Redbox 2014 Annual Report Download - page 65
Download and view the complete annual report
Please find page 65 of the 2014 Redbox annual report below. You can navigate through the pages in the report by either clicking on the pages listed below, or by using the keyword search tool below to find specific information within the annual report.-
 1
1 -
2
-
3
-
4
-
5
-
6
-
7
-
8
-
9
-
10
-
11
-
12
-
13
-
14
-
15
-
16
-
17
-
18
-
19
-
20
-
21
-
22
-
23
-
24
-
25
-
26
-
27
-
28
-
29
-
30
-
31
-
32
-
33
-
34
-
35
-
36
-
37
-
38
-
39
-
40
-
41
-
42
-
43
-
44
-
45
-
46
-
47
-
48
-
49
-
50
-
51
-
52
-
53
-
54
-
 55
55 -
 56
56 -
 57
57 -
 58
58 -
 59
59 -
 60
60 -
 61
61 -
 62
62 -
 63
63 -
 64
64 -
 65
65 -
 66
66 -
 67
67 -
 68
68 -
 69
69 -
 70
70 -
 71
71 -
 72
72 -
 73
73 -
 74
74 -
 75
75 -
76
-
77
-
78
-
79
-
80
-
81
-
82
-
83
-
84
-
85
-
86
-
87
-
88
-
89
-
90
-
91
-
92
-
93
-
94
-
95
-
96
-
97
-
98
-
99
-
100
-
101
-
102
-
103
-
104
-
105
-
106
-
107
-
108
-
109
-
110
-
111
-
112
-
113
-
114
-
115
-
116
-
117
-
118
-
119
-
120
-
121
-
122
-
123
-
124
-
125
-
126
 |
 |

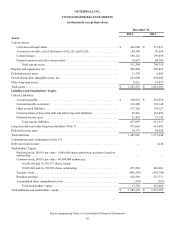
See accompanying Notes to Consolidated Financial Statements
57
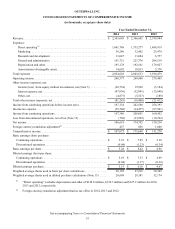
OUTERWALL INC.
CONSOLIDATED STATEMENTS OF COMPREHENSIVE INCOME
(in thousands, except per share data)
Year Ended December 31,
2014 2013 2012
Revenue. . . . . . . . . . . . . . . . . . . . . . . . . . . . . . . . . . . . . . . . . . . . . . . . . . . . . . . . . $ 2,303,003 $ 2,306,601 $ 2,199,884
Expenses:
Direct operating(1) . . . . . . . . . . . . . . . . . . . . . . . . . . . . . . . . . . . . . . . . . . . . . 1,601,748 1,575,277 1,498,819
Marketing. . . . . . . . . . . . . . . . . . . . . . . . . . . . . . . . . . . . . . . . . . . . . . . . . . . . 38,240 32,402 25,979
Research and development . . . . . . . . . . . . . . . . . . . . . . . . . . . . . . . . . . . . . . 13,047 13,084 6,757
General and administrative . . . . . . . . . . . . . . . . . . . . . . . . . . . . . . . . . . . . . . 191,721 221,776 204,519
Depreciation and other. . . . . . . . . . . . . . . . . . . . . . . . . . . . . . . . . . . . . . . . . . 195,178 192,161 179,027
Amortization of intangible assets. . . . . . . . . . . . . . . . . . . . . . . . . . . . . . . . . . 14,692 10,933 5,378
Total expenses. . . . . . . . . . . . . . . . . . . . . . . . . . . . . . . . . . . . . . . . . . . . . . . . . . . . 2,054,626 2,045,633 1,920,479
Operating income . . . . . . . . . . . . . . . . . . . . . . . . . . . . . . . . . . . . . . . . . . . . . . . . . 248,377 260,968 279,405
Other income (expense), net:
Income (loss) from equity method investments, net (Note 5) . . . . . . . . . . . (28,734) 19,928 (5,184)
Interest expense, net. . . . . . . . . . . . . . . . . . . . . . . . . . . . . . . . . . . . . . . . . . . . (47,636)(32,801)(15,648)
Other, net . . . . . . . . . . . . . . . . . . . . . . . . . . . . . . . . . . . . . . . . . . . . . . . . . . . . (4,873)(5,527)(180)
Total other income (expense), net. . . . . . . . . . . . . . . . . . . . . . . . . . . . . . . . . . . . . (81,243)(18,400)(21,012)
Income from continuing operations before income taxes. . . . . . . . . . . . . . . . . . . 167,134 242,568 258,393
Income tax expense. . . . . . . . . . . . . . . . . . . . . . . . . . . . . . . . . . . . . . . . . . . . . . . . (59,748)(34,477)(97,941)
Income from continuing operations . . . . . . . . . . . . . . . . . . . . . . . . . . . . . . . . . . . 107,386 208,091 160,452
Loss from discontinued operations, net of tax (Note 12) . . . . . . . . . . . . . . . . . . . (768)(33,299)(10,222)
Net income . . . . . . . . . . . . . . . . . . . . . . . . . . . . . . . . . . . . . . . . . . . . . . . . . . . . . . 106,618 174,792 150,230
Foreign currency translation adjustment(2) . . . . . . . . . . . . . . . . . . . . . . . . . . . . . . 457 856 1,048
Comprehensive income. . . . . . . . . . . . . . . . . . . . . . . . . . . . . . . . . . . . . . . . . . . . . $ 107,075 $ 175,648 $ 151,278
Basic earnings (loss) per share:
Continuing operations . . . . . . . . . . . . . . . . . . . . . . . . . . . . . . . . . . . . . . . . . . . $ 5.32 $ 7.65 $ 5.30
Discontinued operations. . . . . . . . . . . . . . . . . . . . . . . . . . . . . . . . . . . . . . . . . . (0.04)(1.23)(0.34)
Basic earnings per share . . . . . . . . . . . . . . . . . . . . . . . . . . . . . . . . . . . . . . . . . . . . $ 5.28 $ 6.42 $ 4.96
Diluted earnings (loss) per share:
Continuing operations . . . . . . . . . . . . . . . . . . . . . . . . . . . . . . . . . . . . . . . . . . . $ 5.19 $ 7.33 $ 4.99
Discontinued operations. . . . . . . . . . . . . . . . . . . . . . . . . . . . . . . . . . . . . . . . . . (0.04)(1.17)(0.32)
Diluted earnings per share. . . . . . . . . . . . . . . . . . . . . . . . . . . . . . . . . . . . . . . . . . . $ 5.15 $ 6.16 $ 4.67
Weighted average shares used in basic per share calculations . . . . . . . . . . . . . . . 20,192 27,216 30,305
Weighted average shares used in diluted per share calculations (Note 13) . . . . . 20,699 28,381 32,174
(1) “Direct operating” excludes depreciation and other of $128.8 million, $130.3 million and $127.2 million for 2014,
2013 and 2012, respectively.
(2) Foreign currency translation adjustment had no tax effect in 2014, 2013 and 2012.