Redbox 2014 Annual Report Download - page 44
Download and view the complete annual report
Please find page 44 of the 2014 Redbox annual report below. You can navigate through the pages in the report by either clicking on the pages listed below, or by using the keyword search tool below to find specific information within the annual report.-
 1
1 -
2
-
3
-
4
-
5
-
6
-
7
-
8
-
9
-
10
-
11
-
12
-
13
-
14
-
15
-
16
-
17
-
18
-
19
-
20
-
21
-
22
-
23
-
24
-
25
-
26
-
27
-
28
-
29
-
30
-
31
-
32
-
33
-
 34
34 -
 35
35 -
 36
36 -
 37
37 -
 38
38 -
 39
39 -
 40
40 -
 41
41 -
 42
42 -
 43
43 -
 44
44 -
 45
45 -
 46
46 -
 47
47 -
 48
48 -
 49
49 -
 50
50 -
 51
51 -
 52
52 -
 53
53 -
 54
54 -
55
-
56
-
57
-
58
-
59
-
60
-
61
-
62
-
63
-
64
-
65
-
66
-
67
-
68
-
69
-
70
-
71
-
72
-
73
-
74
-
75
-
76
-
77
-
78
-
79
-
80
-
81
-
82
-
83
-
84
-
85
-
86
-
87
-
88
-
89
-
90
-
91
-
92
-
93
-
94
-
95
-
96
-
97
-
98
-
99
-
100
-
101
-
102
-
103
-
104
-
105
-
106
-
107
-
108
-
109
-
110
-
111
-
112
-
113
-
114
-
115
-
116
-
117
-
118
-
119
-
120
-
121
-
122
-
123
-
124
-
125
-
126
 |
 |
36
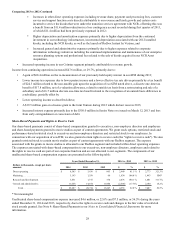
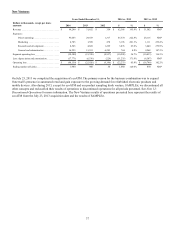
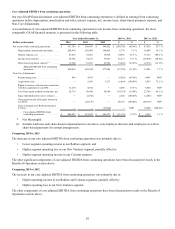
Comparing 2013 to 2012
Revenue increased $9.5 million, or 3.3%, primarily due to growth of U.S. same store sales and revenue from TDCT locations.
The increase in same store sales in the U.S. was driven by the price increase implemented across all grocery locations in the
U.S. The average coin-to-voucher transaction size continued to increase and the volume of non-cash voucher products increased
by 0.3%. Revenue increased at a rate lower than the increase in transaction size due to variations in country and product mix,
including growth in Canada driven by TDCT, which has a different revenue model than regular coin-to-voucher transactions.
Same store sales grew in the U.S. driven by growth from the fee increase in fourth quarter of 2013, and the fact that revenue
from kiosks installed in 2011 was fully included in the 2012 same store sales measurement. This was slightly offset by reduced
same store sales in the UK and Canada.
The average coin-to-voucher transaction size continued to increase and the volume of non-cash voucher products increased by
0.3%. Revenue increased at a rate lower than the increase in transaction size due to variations in country and product mix,
including growth in Canada driven by TDCT, which has a different revenue model than regular coin-to-voucher transactions.
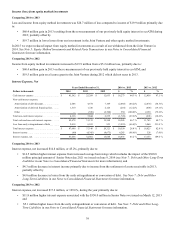
Operating income increased $5.4 million, or 8.6%, primarily due to the following:
• $9.5 million increase in revenue as described above; and
• $2.2 million decrease in depreciation and amortization expense due to incremental expense associated with one-time
expense for internal use software in the nine months ended September 30, 2012 for $2.5 million which did not recur in
2013, offset by lower machine disposal losses; partially offset by
• $1.3 million increase in marketing expenses primarily due to timing of advertising and spending to support our
programs in 2013;
• $2.8 million increase in direct operating expenses primarily due to higher revenue share expense attributable to both
revenue growth and increased revenue share rates with certain retail partners as a result of long-term contract renewals;
higher coin processing and transportation related expenses arising from higher revenue and incremental costs to
outsource the transportation function in Canada in 2013; and
• $2.5 million increase in research and development expenses primarily due to an increase in kiosk software and
hardware engineering efforts for our Coinstar and gift card exchange business kiosks.