Redbox 2014 Annual Report Download - page 97
Download and view the complete annual report
Please find page 97 of the 2014 Redbox annual report below. You can navigate through the pages in the report by either clicking on the pages listed below, or by using the keyword search tool below to find specific information within the annual report.-
 1
1 -
2
-
3
-
4
-
5
-
6
-
7
-
8
-
9
-
10
-
11
-
12
-
13
-
14
-
15
-
16
-
17
-
18
-
19
-
20
-
21
-
22
-
23
-
24
-
25
-
26
-
27
-
28
-
29
-
30
-
31
-
32
-
33
-
34
-
35
-
36
-
37
-
38
-
39
-
40
-
41
-
42
-
43
-
44
-
45
-
46
-
47
-
48
-
49
-
50
-
51
-
52
-
53
-
54
-
55
-
56
-
57
-
58
-
59
-
60
-
61
-
62
-
63
-
64
-
65
-
66
-
67
-
68
-
69
-
70
-
71
-
72
-
73
-
74
-
75
-
76
-
77
-
78
-
79
-
80
-
81
-
82
-
83
-
84
-
85
-
86
-
 87
87 -
 88
88 -
 89
89 -
 90
90 -
 91
91 -
 92
92 -
 93
93 -
 94
94 -
 95
95 -
 96
96 -
 97
97 -
 98
98 -
 99
99 -
 100
100 -
 101
101 -
 102
102 -
 103
103 -
 104
104 -
 105
105 -
 106
106 -
 107
107 -
108
-
109
-
110
-
111
-
112
-
113
-
114
-
115
-
116
-
117
-
118
-
119
-
120
-
121
-
122
-
123
-
124
-
125
-
126
 |
 |

89
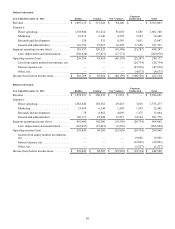
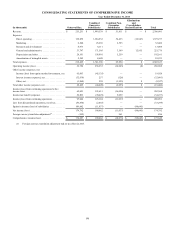
Dollars in thousands
Year Ended December 31, 2014 Redbox Coinstar New Ventures
Corporate
Unallocated Total
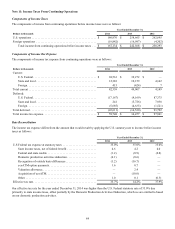
Revenue . . . . . . . . . . . . . . . . . . . . . . . . . . . . . . . $ 1,893,135 $ 315,628 $ 94,240 $ — $ 2,303,003
Expenses:
Direct operating. . . . . . . . . . . . . . . . . . . . . . 1,338,946 161,214 95,003 6,585 1,601,748
Marketing . . . . . . . . . . . . . . . . . . . . . . . . . . 23,916 6,346 4,785 3,193 38,240
Research and development . . . . . . . . . . . . . 120 531 8,545 3,851 13,047
General and administrative . . . . . . . . . . . . . 136,756 27,012 16,295 11,658 191,721
Segment operating income (loss) . . . . . . . . . . . . 393,397 120,525 (30,388)(25,287) 458,247
Less: depreciation and amortization . . . . . . (156,628) (35,471)(17,771)—
(209,870)
Operating income (loss) . . . . . . . . . . . . . . . . . . . 236,769 85,054 (48,159)(25,287) 248,377
Loss from equity method investments, net .———
(28,734)(28,734)
Interest expense, net . . . . . . . . . . . . . . . . . . ———
(47,636)(47,636)
Other, net. . . . . . . . . . . . . . . . . . . . . . . . . . . ———
(4,873)(4,873)
Income (loss) before income taxes. . . . . . . . . . . $ 236,769 $ 85,054 $ (48,159)$ (106,530) $ 167,134
Dollars in thousands
Year Ended December 31, 2013 Redbox Coinstar New Ventures
Corporate
Unallocated Total
Revenue . . . . . . . . . . . . . . . . . . . . . . . . . . . . . . . $ 1,974,531 $ 300,218 $ 31,852 $ — $ 2,306,601
Expenses:
Direct operating. . . . . . . . . . . . . . . . . . . . . . 1,383,646 158,562 29,433 3,636 1,575,277
Marketing . . . . . . . . . . . . . . . . . . . . . . . . . . 23,010 6,244 1,589 1,559 32,402
Research and development . . . . . . . . . . . . . 78 6,962 4,669 1,375 13,084
General and administrative . . . . . . . . . . . . . 166,117 25,944 15,551 14,164 221,776
Segment operating income (loss) . . . . . . . . . . . . 401,680 102,506 (19,390)(20,734) 464,062
Less: depreciation and amortization . . . . . . (162,637) (33,921)(6,536)—
(203,094)
Operating income (loss) . . . . . . . . . . . . . . . . . . . 239,043 68,585 (25,926)(20,734) 260,968
Income from equity method investments,
net . . . . . . . . . . . . . . . . . . . . . . . . . . . . . . . . — — — 19,928 19,928
Interest expense, net . . . . . . . . . . . . . . . . . . ———
(32,801)(32,801)
Other, net. . . . . . . . . . . . . . . . . . . . . . . . . . . ———
(5,527)(5,527)
Income (loss) before income taxes. . . . . . . . . . . $ 239,043 $ 68,585 $ (25,926)$ (39,134) $ 242,568