Redbox 2014 Annual Report Download - page 43
Download and view the complete annual report
Please find page 43 of the 2014 Redbox annual report below. You can navigate through the pages in the report by either clicking on the pages listed below, or by using the keyword search tool below to find specific information within the annual report.-
 1
1 -
2
-
3
-
4
-
5
-
6
-
7
-
8
-
9
-
10
-
11
-
12
-
13
-
14
-
15
-
16
-
17
-
18
-
19
-
20
-
21
-
22
-
23
-
24
-
25
-
26
-
27
-
28
-
29
-
30
-
31
-
32
-
 33
33 -
 34
34 -
 35
35 -
 36
36 -
 37
37 -
 38
38 -
 39
39 -
 40
40 -
 41
41 -
 42
42 -
 43
43 -
 44
44 -
 45
45 -
 46
46 -
 47
47 -
 48
48 -
 49
49 -
 50
50 -
 51
51 -
 52
52 -
 53
53 -
54
-
55
-
56
-
57
-
58
-
59
-
60
-
61
-
62
-
63
-
64
-
65
-
66
-
67
-
68
-
69
-
70
-
71
-
72
-
73
-
74
-
75
-
76
-
77
-
78
-
79
-
80
-
81
-
82
-
83
-
84
-
85
-
86
-
87
-
88
-
89
-
90
-
91
-
92
-
93
-
94
-
95
-
96
-
97
-
98
-
99
-
100
-
101
-
102
-
103
-
104
-
105
-
106
-
107
-
108
-
109
-
110
-
111
-
112
-
113
-
114
-
115
-
116
-
117
-
118
-
119
-
120
-
121
-
122
-
123
-
124
-
125
-
126
 |
 |

35
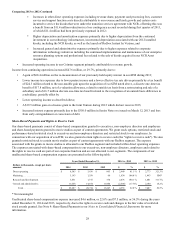
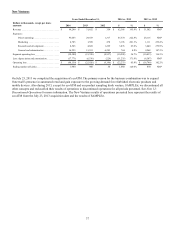
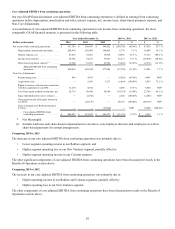
Coinstar
Years Ended December 31, 2014 vs. 2013 2013 vs. 2012
Dollars in thousands, except per share
amounts 2014 2013 2012 $%$%
Revenue . . . . . . . . . . . . . . . . . . . . . . . . . . . . . . . . $ 315,628 $ 300,218 $ 290,761 $ 15,410 5.1 % $ 9,457 3.3 %
Expenses:
Direct operating. . . . . . . . . . . . . . . . . . . . . . 161,214 158,562 155,740 2,652 1.7 % 2,822 1.8 %
Marketing . . . . . . . . . . . . . . . . . . . . . . . . . . 6,346 6,244 4,938 102 1.6 % 1,306 26.4 %
Research and development . . . . . . . . . . . . . 531 6,962 4,455 (6,431) (92.4)% 2,507 56.3 %
General and administrative . . . . . . . . . . . . . 27,012 25,944 26,367 1,068 4.1 % (423) (1.6)%
Segment operating income . . . . . . . . . . . . . . . . . . 120,525 102,506 99,261 18,019 17.6 % 3,245 3.3 %
Less: depreciation and amortization. . . . . . . . . . . (35,471) (33,921) (36,108) (1,550) 4.6 % 2,187 (6.1)%
Operating income . . . . . . . . . . . . . . . . . . . . . . . . . $ 85,054 $ 68,585 $ 63,153 $ 16,469 24.0 % $ 5,432 8.6 %
Operating income as a percentage of revenue . . . 26.9% 22.8% 21.7 %
Same store sales growth (decline) . . . . . . . . . . . . 4.7% 1.4% (0.1)%
Ending number of kiosks . . . . . . . . . . . . . . . . . . . 21,340 20,900 20,300 440 2.1 % 600 3.0 %
Total transactions (in thousands) . . . . . . . . . . . . . 72,957 76,120 76,954 (3,163) (4.2)% (834) (1.1)%
Average transaction size. . . . . . . . . . . . . . . . . . . . $ 42.12 $ 41.39 $ 39.30 $ 0.73 1.8 % $ 2.09 5.3 %
* Not Meaningful
2014 Events
• Effective August 1, 2014, we increased the coin voucher product transaction fee from 8.9% to 9.9% at all U.K. grocery
retail locations.
Comparing 2014 to 2013
Revenue increased $15.4 million, or 5.1%, primarily due to:
• Same store sales growth in the U.S. driven by a price increase implemented across all grocery locations effective
October 1, 2013;
• Higher volume in the U.K. due to an increased U.K. kiosk base;
• Same store sales growth in the U.K driven by a price increase on August 1, 2014; and
• Growth in the number of Coinstar Exchange kiosks.
The average transaction size continued to increase during 2014 while the number of transactions has declined. The decline in
transactions is the result of larger pours and less frequent visits, a slight decrease in the U.S. kiosk base year over year as a
result of optimization efforts, the expected volume decline as a result of the U.S. price increase, and the impact of the Royal
Canadian Mint’s penny reclamation efforts in Canada.
Operating income increased $16.5 million, or 24.0%, primarily due to the following:
• $15.4 million increase in revenue as described above; and
• $6.4 million decrease in research and development expenses primarily due to a reduction in kiosk hardware and
software engineering efforts for Coinstar and Coinstar Exchange; partially offset by
• $1.1 million increase in general and administrative expenses primarily due to increased expenses associated with the
growth of our Coinstar Exchange business;
• $2.7 million increase in direct operating expenses due to increased revenue sharing, selling and customer service costs
to support higher revenues; and
• $1.6 million increase in depreciation and amortization expense due to higher depreciation expense as a result of
continued investment in our corporate technology infrastructure and the write-off of technology assets.