Redbox 2014 Annual Report Download - page 48
Download and view the complete annual report
Please find page 48 of the 2014 Redbox annual report below. You can navigate through the pages in the report by either clicking on the pages listed below, or by using the keyword search tool below to find specific information within the annual report.-
 1
1 -
2
-
3
-
4
-
5
-
6
-
7
-
8
-
9
-
10
-
11
-
12
-
13
-
14
-
15
-
16
-
17
-
18
-
19
-
20
-
21
-
22
-
23
-
24
-
25
-
26
-
27
-
28
-
29
-
30
-
31
-
32
-
33
-
34
-
35
-
36
-
37
-
 38
38 -
 39
39 -
 40
40 -
 41
41 -
 42
42 -
 43
43 -
 44
44 -
 45
45 -
 46
46 -
 47
47 -
 48
48 -
 49
49 -
 50
50 -
 51
51 -
 52
52 -
 53
53 -
 54
54 -
 55
55 -
 56
56 -
 57
57 -
 58
58 -
59
-
60
-
61
-
62
-
63
-
64
-
65
-
66
-
67
-
68
-
69
-
70
-
71
-
72
-
73
-
74
-
75
-
76
-
77
-
78
-
79
-
80
-
81
-
82
-
83
-
84
-
85
-
86
-
87
-
88
-
89
-
90
-
91
-
92
-
93
-
94
-
95
-
96
-
97
-
98
-
99
-
100
-
101
-
102
-
103
-
104
-
105
-
106
-
107
-
108
-
109
-
110
-
111
-
112
-
113
-
114
-
115
-
116
-
117
-
118
-
119
-
120
-
121
-
122
-
123
-
124
-
125
-
126
 |
 |

40
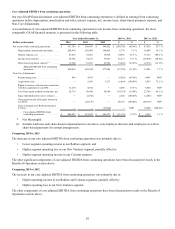
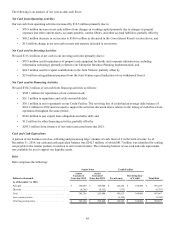
Other Expense, Net
Dollars in thousands
Years Ended December 31, 2014 vs. 2013 2013 vs. 2012
2014 2013 2012 $ % $ %
Other, net . . . . . . . . . . . . . . . . . . . . . . . . . . . . . . . . . . . . . $ (4,873) $ (5,527) $ (180) $ 654 (11.8)% $ (5,347) NM*
* Not Meaningful
Comparing 2014 to 2013
Other expense, net decreased by $0.7 million or 11.8% to $4.9 million primarily due to:
• $3.0 million higher foreign currency related losses to $6.2 million primarily due to the impact of the Canadian dollar
exchange rates on our Redbox Canada and Coinstar Canada operations; offset by
• $2.8 million in expense incurred to write-down the carrying value of a note receivable from Sigue incurred during
2013 which did not recur in 2014.
Comparing 2013 to 2012
Other expense, increased by $5.3 million to $5.5 million primarily due to:
• $3.1 million higher foreign currency related losses to $3.3 million primarily due to the impact of the Canadian dollar
exchange rates on our Redbox Canada and Coinstar Canada operations; and
• $2.8 million in expense incurred to write-down the carrying value of a note receivable from Sigue. See Note 16: Fair
Value
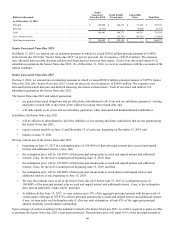
Income Tax Expense
Dollars in thousands
Year Ended December 31,
2014 vs 2013 2013 vs 20122014 2013 2012
Income tax expense . . . . . . . . . . . . . . . . . . . . . . . . . . . . . . . . . . . . . . . $ (59,748) $ (34,477) $ (97,941) $ (25,271) $ 63,464
Effective tax rate. . . . . . . . . . . . . . . . . . . . . . . . . . . . . . . . . . . . . . . . . . 35.7% 14.2% 37.9% 21.5 % pts (23.7) % pts
Income tax expense and effective tax rates are driven by recurring items, such as tax rates in foreign jurisdictions and the
relative amount of income we earn in each. It is also affected by permanent differences in the recognition of income and
expenses for income tax purposes vs. financial reporting purposes and various discrete items that may occur in any given year,
but are not consistent from year to year. The most significant, recurring permanent difference impacting our income tax expense
is the Domestic Production Activities Deduction ("DPAD") which we are entitled to based on Redbox's domestic production
activities.
Comparing 2014 to 2013
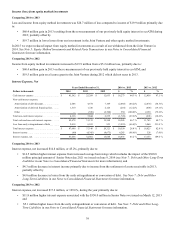
Income tax expense increased by $25.3 million resulting from higher taxable income primarily driven by:
• $34.5 million in tax benefits related to discrete items occurring in 2013 composed of:
$16.7 million related to the recognition of a worthless stock deduction from an outside basis difference in a
corporate subsidiary in 2013; and
$17.8 million, net of a valuation allowance, through the realization of capital and ordinary gains and losses
associated with the series of transactions to reorganize Redbox related subsidiary structures through the sale
of a wholly owned subsidiary; partially offset by
• $5.3 million increase in the DPAD from $1.5 million in 2013 to $6.8 million in 2014; and
• $3.9 million in additional impact primarily driven by the $7.1 million decrease in Income from continuing operations
before income taxes excluding the $68.4 million non-taxable gain on previously held equity interest in ecoATM.
Comparing 2013 to 2012
Income tax expense decreased by $63.5 million primarily driven by:
• $34.5 million in tax benefits related to discrete items occurring in 2013 composed of: