Redbox 2014 Annual Report Download - page 104
Download and view the complete annual report
Please find page 104 of the 2014 Redbox annual report below. You can navigate through the pages in the report by either clicking on the pages listed below, or by using the keyword search tool below to find specific information within the annual report.-
 1
1 -
2
-
3
-
4
-
5
-
6
-
7
-
8
-
9
-
10
-
11
-
12
-
13
-
14
-
15
-
16
-
17
-
18
-
19
-
20
-
21
-
22
-
23
-
24
-
25
-
26
-
27
-
28
-
29
-
30
-
31
-
32
-
33
-
34
-
35
-
36
-
37
-
38
-
39
-
40
-
41
-
42
-
43
-
44
-
45
-
46
-
47
-
48
-
49
-
50
-
51
-
52
-
53
-
54
-
55
-
56
-
57
-
58
-
59
-
60
-
61
-
62
-
63
-
64
-
65
-
66
-
67
-
68
-
69
-
70
-
71
-
72
-
73
-
74
-
75
-
76
-
77
-
78
-
79
-
80
-
81
-
82
-
83
-
84
-
85
-
86
-
87
-
88
-
89
-
90
-
91
-
92
-
93
-
 94
94 -
 95
95 -
 96
96 -
 97
97 -
 98
98 -
 99
99 -
 100
100 -
 101
101 -
 102
102 -
 103
103 -
 104
104 -
 105
105 -
 106
106 -
 107
107 -
 108
108 -
 109
109 -
 110
110 -
 111
111 -
 112
112 -
 113
113 -
 114
114 -
115
-
116
-
117
-
118
-
119
-
120
-
121
-
122
-
123
-
124
-
125
-
126
 |
 |

96
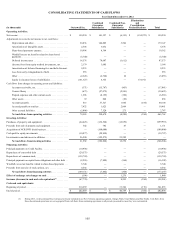
CONSOLIDATING BALANCE SHEETS
As of December 31, 2014
(in thousands) Outerwall Inc.
Combined
Guarantor
Subsidiaries
Combined Non-
Guarantor
Subsidiaries
Eliminations
and
Consolidation
Reclassifications Total
Assets
Current Assets:
Cash and cash equivalents . . . . . . . . . . . . . . . . . . $ 180,889 $ 17,939 $ 43,868 $ — $ 242,696
Accounts receivable, net of allowances . . . . . . . . 3,203 43,874 1,513 — 48,590
Content library . . . . . . . . . . . . . . . . . . . . . . . . . . . — 176,490 3,631 — 180,121
Prepaid expenses and other current assets . . . . . . 21,442 23,923 1,030 (6,558) 39,837
Intercompany receivables. . . . . . . . . . . . . . . . . . . 40,762 467,181 — (507,943) —
Total current assets . . . . . . . . . . . . . . . . . . . 246,296 729,407 50,042 (514,501) 511,244
Property and equipment, net . . . . . . . . . . . . . . . . . . . . . 133,923 263,412 31,133 — 428,468
Deferred income taxes. . . . . . . . . . . . . . . . . . . . . . . . . . — — 11,378 — 11,378
Goodwill and other intangible assets, net . . . . . . . . . . . 249,717 374,281 — — 623,998
Other long-term assets. . . . . . . . . . . . . . . . . . . . . . . . . . 6,665 1,231 335 — 8,231
Investment in related parties . . . . . . . . . . . . . . . . . . . . . 917,234 (5,114) — (912,120) —
Total assets. . . . . . . . . . . . . . . . . . . . . . . . . . . . . . . . . . . $ 1,553,835 $ 1,363,217 $ 92,888 $ (1,426,621) $ 1,583,319
Liabilities and Stockholders’ Equity
Current Liabilities:
Accounts payable . . . . . . . . . . . . . . . . . . . . . . . . . $ 12,899 $ 153,260 $ 2,474 $ — $ 168,633
Accrued payable to retailers . . . . . . . . . . . . . . . . . 69,189 42,977 14,124 — 126,290
Other accrued liabilities . . . . . . . . . . . . . . . . . . . . 59,770 74,536 2,820 — 137,126
Current portion of long-term debt and other
long-term liabilities . . . . . . . . . . . . . . . . . . . . . . . 20,020 — 396 — 20,416
Deferred income taxes . . . . . . . . . . . . . . . . . . . . . — 27,961 29 (6,558) 21,432
Intercompany payables. . . . . . . . . . . . . . . . . . . . . 309,932 121,015 76,996 (507,943) —
Total current liabilities. . . . . . . . . . . . . . . . . 471,810 419,749 96,839 (514,501) 473,897
Long-term debt and other long-term liabilities . . . . . . . 949,588 22,946 1,135 — 973,669
Deferred income taxes. . . . . . . . . . . . . . . . . . . . . . . . . . 35,058 3,288 29 — 38,375
Total liabilities. . . . . . . . . . . . . . . . . . . . . . . . . . . . . . . . 1,456,456 445,983 98,003 (514,501) 1,485,941
Commitments and contingencies
Stockholders’ Equity:
Preferred stock . . . . . . . . . . . . . . . . . . . . . . . . . . . —————
Common stock . . . . . . . . . . . . . . . . . . . . . . . . . . . 588,105 225,729 12,393 (352,635) 473,592
Treasury stock . . . . . . . . . . . . . . . . . . . . . . . . . . . (996,293) — — — (996,293)
Retained earnings . . . . . . . . . . . . . . . . . . . . . . . . . 506,360 691,505 (17,991) (559,485) 620,389
Accumulated other comprehensive income (loss) (793) — 483 — (310)
Total stockholders’ equity . . . . . . . . . . . . . . 97,379 917,234 (5,115) (912,120) 97,378
Total liabilities and stockholders’ equity. . . . . . . . . . . . $ 1,553,835 $ 1,363,217 $ 92,888 $ (1,426,621) $ 1,583,319