Redbox 2014 Annual Report Download - page 45
Download and view the complete annual report
Please find page 45 of the 2014 Redbox annual report below. You can navigate through the pages in the report by either clicking on the pages listed below, or by using the keyword search tool below to find specific information within the annual report.-
 1
1 -
2
-
3
-
4
-
5
-
6
-
7
-
8
-
9
-
10
-
11
-
12
-
13
-
14
-
15
-
16
-
17
-
18
-
19
-
20
-
21
-
22
-
23
-
24
-
25
-
26
-
27
-
28
-
29
-
30
-
31
-
32
-
33
-
34
-
 35
35 -
 36
36 -
 37
37 -
 38
38 -
 39
39 -
 40
40 -
 41
41 -
 42
42 -
 43
43 -
 44
44 -
 45
45 -
 46
46 -
 47
47 -
 48
48 -
 49
49 -
 50
50 -
 51
51 -
 52
52 -
 53
53 -
 54
54 -
 55
55 -
56
-
57
-
58
-
59
-
60
-
61
-
62
-
63
-
64
-
65
-
66
-
67
-
68
-
69
-
70
-
71
-
72
-
73
-
74
-
75
-
76
-
77
-
78
-
79
-
80
-
81
-
82
-
83
-
84
-
85
-
86
-
87
-
88
-
89
-
90
-
91
-
92
-
93
-
94
-
95
-
96
-
97
-
98
-
99
-
100
-
101
-
102
-
103
-
104
-
105
-
106
-
107
-
108
-
109
-
110
-
111
-
112
-
113
-
114
-
115
-
116
-
117
-
118
-
119
-
120
-
121
-
122
-
123
-
124
-
125
-
126
 |
 |

37
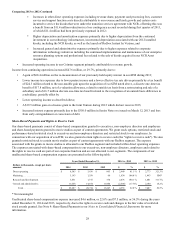
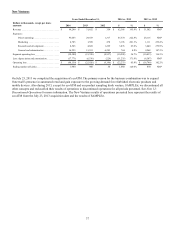
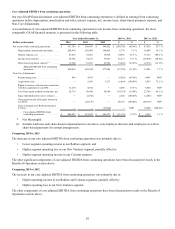
New Ventures
Years Ended December 31, 2014 vs. 2013 2013 vs. 2012
Dollars in thousands, except per share
amounts 2014 2013 2012 $%$%
Revenue . . . . . . . . . . . . . . . . . . . . . . . . . . . . . . . . $ 94,240 $ 31,852 $ 350 $ 62,388 195.9% $ 31,502 NM*
Expenses:
Direct operating. . . . . . . . . . . . . . . . . . . . . . 95,003 29,433 1,317 65,570 222.8% 28,116 NM*
Marketing . . . . . . . . . . . . . . . . . . . . . . . . . . 4,785 1,589 478 3,196 201.1% 1,111 232.4%
Research and development . . . . . . . . . . . . . 8,545 4,669 1,229 3,876 83.0% 3,440 279.9%
General and administrative . . . . . . . . . . . . . 16,295 15,551 6,283 744 4.8% 9,268 147.5%
Segment operating loss. . . . . . . . . . . . . . . . . . . . . (30,388) (19,390) (8,957) (10,998) 56.7% (10,433) 116.5%
Less: depreciation and amortization. . . . . . . . . . . (17,771) (6,536) (229) (11,235) 171.9% (6,307) NM*
Operating loss. . . . . . . . . . . . . . . . . . . . . . . . . . . . $ (48,159) $ (25,926) $ (9,186) $ (22,233) 85.8% $ (16,740) 182.2%
Ending number of kiosks . . . . . . . . . . . . . . . . . . . 1,980 900 50 1,080 120.0% 850 NM*
On July 23, 2013 we completed the acquisition of ecoATM. The primary reason for the business combination was to expand
Outerwall’s presence in automated retail and gain exposure to the growing demand for refurbished electronic products and
mobile devices. Also during 2013, except for ecoATM and our product sampling kiosk venture, SAMPLEit, we discontinued all
other concepts and reclassified their results of operations to discontinued operations for all periods presented. See Note 12:
Discontinued Operations for more information. The New Ventures results of operations presented here represent the results of
ecoATM from the July 23, 2013 acquisition date and the results of SAMPLEit.