Redbox 2014 Annual Report Download - page 47
Download and view the complete annual report
Please find page 47 of the 2014 Redbox annual report below. You can navigate through the pages in the report by either clicking on the pages listed below, or by using the keyword search tool below to find specific information within the annual report.-
 1
1 -
2
-
3
-
4
-
5
-
6
-
7
-
8
-
9
-
10
-
11
-
12
-
13
-
14
-
15
-
16
-
17
-
18
-
19
-
20
-
21
-
22
-
23
-
24
-
25
-
26
-
27
-
28
-
29
-
30
-
31
-
32
-
33
-
34
-
35
-
36
-
 37
37 -
 38
38 -
 39
39 -
 40
40 -
 41
41 -
 42
42 -
 43
43 -
 44
44 -
 45
45 -
 46
46 -
 47
47 -
 48
48 -
 49
49 -
 50
50 -
 51
51 -
 52
52 -
 53
53 -
 54
54 -
 55
55 -
 56
56 -
 57
57 -
58
-
59
-
60
-
61
-
62
-
63
-
64
-
65
-
66
-
67
-
68
-
69
-
70
-
71
-
72
-
73
-
74
-
75
-
76
-
77
-
78
-
79
-
80
-
81
-
82
-
83
-
84
-
85
-
86
-
87
-
88
-
89
-
90
-
91
-
92
-
93
-
94
-
95
-
96
-
97
-
98
-
99
-
100
-
101
-
102
-
103
-
104
-
105
-
106
-
107
-
108
-
109
-
110
-
111
-
112
-
113
-
114
-
115
-
116
-
117
-
118
-
119
-
120
-
121
-
122
-
123
-
124
-
125
-
126
 |
 |

39
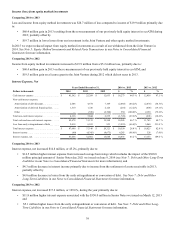
Income (loss) from equity method investments
Comparing 2014 to 2013
Loss and income from equity method investments was $28.7 million of loss compared to income of $19.9 million primarily due
to:
• $68.4 million gain in 2013 resulting from the re-measurement of our previously held equity interest in ecoATM during
2013; partially offset by
• $19.7 million in lower losses from our investment in the Joint Venture and other equity method investments.
In 2015 we expect reduced impact from equity method investments as a result of our withdrawal from the Joint Venture in
2014. See Note 5: Equity Method Investments and Related Party Transactions in our Notes to Consolidated Financial
Statements for more information.
Comparing 2013 to 2012
Income from equity method investments increased to $19.9 million from a $5.2 million loss, primarily due to:
• $68.4 million gain in 2013 on the re-measurement of our previously held equity interest in ecoATM; and
• $19.5 million gain on a license grant to the Joint Venture during 2012 which did not recur in 2013.
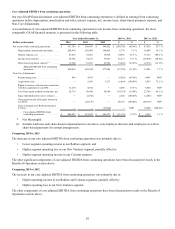
Interest Expense, Net
Dollars in thousands
Years Ended December 31, 2014 vs. 2013 2013 vs. 2012
2014 2013 2012 $%$%
Cash interest expense . . . . . . . . . . . . . . . . . . . . . . $ 41,562 $ 25,289 $ 12,833 $ 16,273 64.3 % $ 12,456 97.1 %
Non-cash interest expense:
Amortization of debt discount. . . . . . . . . . . . . . 2,606 4,674 7,109 (2,068) (44.2)% (2,435) (34.3)%
Amortization of deferred financing fees . . . . . . 1,510 1,720 2,126 (210) (12.2)% (406) (19.1)%
Other . . . . . . . . . . . . . . . . . . . . . . . . . . . . . . . . . — (550) (2,700) 550 (100.0)% 2,150 (79.6)%
Total non-cash interest expense . . . . . . . . . . . . . . 4,116 5,844 6,535 (1,728) (29.6)% (691) (10.6)%
Total cash and non-cash interest expense. . . . . . . 45,678 31,133 19,368 14,545 46.7 % 11,765 60.7 %
Loss from early extinguishment of debt. . . . . . . . 2,018 6,013 953 (3,995) (66.4)% 5,060 531.0 %
Total interest expense. . . . . . . . . . . . . . . . . . . . . . $ 47,696 $ 37,146 $ 20,321 $ 10,550 28.4 % $ 16,825 82.8 %
Interest income . . . . . . . . . . . . . . . . . . . . . . . . . . . (60) (4,345) (4,673) 4,285 (98.6)% 328 (7.0)%
Interest expense, net . . . . . . . . . . . . . . . . . . . . . . . 47,636 32,801 15,648 14,835 45.2 % 17,153 109.6 %
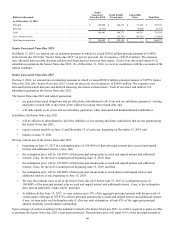
Comparing 2014 to 2013
Interest expense, net increased $14.8 million, or 45.2%, primarily due to:
• $14.5 million higher interest expense from increased average borrowings which includes the impact of the $300.0
million principal amount of Senior Notes due 2021 we issued on June 9, 2014 (see Note 7: Debt and Other Long-Term
Liabilities in our Notes to Consolidated Financial Statements for more information); and
• $4.3 million decrease in interest income primarily due to income from the settlement of a note receivable in 2013;
partially offset by
• $4.0 million decrease in losses from the early extinguishment or conversion of debt. See Note 7: Debt and Other
Long-Term Liabilities in our Notes to Consolidated Financial Statements for more information.
Comparing 2013 to 2012
Interest expense, net increased $17.2 million, or 109.6%, during the year primarily due to:
• $11.8 million higher interest expense associated with the $350.0 million in Senior Notes we issued on March 12, 2013
and
• $5.1 million higher losses from the early extinguishment or conversion of debt. See Note 7: Debt and Other Long-
Term Liabilities in our Notes to Consolidated Financial Statements for more information.