Redbox 2014 Annual Report Download - page 40
Download and view the complete annual report
Please find page 40 of the 2014 Redbox annual report below. You can navigate through the pages in the report by either clicking on the pages listed below, or by using the keyword search tool below to find specific information within the annual report.-
 1
1 -
2
-
3
-
4
-
5
-
6
-
7
-
8
-
9
-
10
-
11
-
12
-
13
-
14
-
15
-
16
-
17
-
18
-
19
-
20
-
21
-
22
-
23
-
24
-
25
-
26
-
27
-
28
-
29
-
 30
30 -
 31
31 -
 32
32 -
 33
33 -
 34
34 -
 35
35 -
 36
36 -
 37
37 -
 38
38 -
 39
39 -
 40
40 -
 41
41 -
 42
42 -
 43
43 -
 44
44 -
 45
45 -
 46
46 -
 47
47 -
 48
48 -
 49
49 -
 50
50 -
51
-
52
-
53
-
54
-
55
-
56
-
57
-
58
-
59
-
60
-
61
-
62
-
63
-
64
-
65
-
66
-
67
-
68
-
69
-
70
-
71
-
72
-
73
-
74
-
75
-
76
-
77
-
78
-
79
-
80
-
81
-
82
-
83
-
84
-
85
-
86
-
87
-
88
-
89
-
90
-
91
-
92
-
93
-
94
-
95
-
96
-
97
-
98
-
99
-
100
-
101
-
102
-
103
-
104
-
105
-
106
-
107
-
108
-
109
-
110
-
111
-
112
-
113
-
114
-
115
-
116
-
117
-
118
-
119
-
120
-
121
-
122
-
123
-
124
-
125
-
126
 |
 |

32
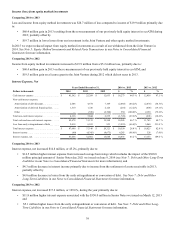
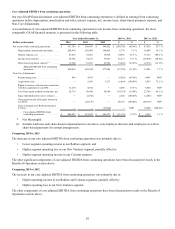
Comparing 2014 to 2013
Revenue decreased $81.4 million, or 4.1%, primarily due to the following:
• $95.8 million decrease from a 4.9% decrease in same store sales primarily due to:
Relative attractiveness and timing of title releases - while total box office (representing titles with total North
American box office receipts of at least $5.0 million) for content released during 2014 increased 8.1%,
significantly lower box office during certain periods of 2014 (particularly in the second and third quarters) led
to a lack of strong content throughout the year which, combined with the impact from the expected secular
decline in the market, contributed to a 6.8% decrease in rentals in 2014;
Revenue from video game rentals decreased $17.3 million primarily due to a lighter release slate during the
first and second quarters because of the game industry’s shift to next generation platforms and under
performance of certain games titles; partially offset by
More effective promotional activity that leverages customer-specific offerings and an increase in the daily
rental fees for movie content implemented in December 2014.
• $2.7 million decrease to zero from revenue earned by kiosks acquired from NCR as noted above; partially offset by
• $17.1 million in revenue from newly installed or relocated kiosks including those that replaced the remaining NCR
kiosks.
Net revenue per rental increased $0.08 to $2.62 primarily due to:
• A continued increase in Blu-ray rentals which we consider a key focus for future revenue growth as it has a higher
revenue and margin dollar per rental and offers consumers a better viewing experience due to superior picture and
sound quality compared to other options such as digital streaming and video on demand. Blu-ray rentals represented
15.0% of total disc rentals and 17.6% of revenue during 2014 as compared to 13.1% of total disc rentals and 15.4% of
revenue during 2013; partially offset by
• Lower video game rentals, which declined 16.8% during 2014 as compared to 2013 primarily due to the factors
discussed above.
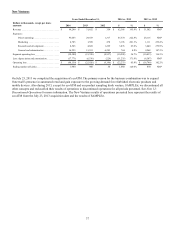
Operating income decreased $2.3 million, primarily due to the following:
• $81.4 million decrease in revenue as described above; partially offset by
• $44.7 million decrease in direct operating expenses, which were 70.7% of revenue in 2014 as compared to 70.1% in
2013, primarily as a result of:
Product costs decreased $9.8 million to $820.8 million primarily due to lower spending on content in 2014
partially offset by a change in how we amortize our product costs in our content library that was prospectively
applied as explained in Note 2: Summary of Significant Accounting Policies in our Notes to Consolidated
Financial Statements resulting in a $21.7 million benefit which was recorded in the second quarter of 2013 to
reflect an increase in the ending value of the Redbox content library as of June 30, 2013. For comparability
purposes, product cost in 2013 would have been $23.8 million higher had the new methodology been applied
retrospectively as costs would have shifted from prior periods into 2013;
Gross margin decreased by 130 basis points to 56.6% in 2014 primarily due to the performance of the content
library as a result of the relative attractiveness of titles available for rent and the timing of the release schedule
in 2014 partially offset by a $3.4 million decrease in studio-related share-based expenses and closing
underperforming NCR kiosks. The 2013 period also benefited from an $11.4 million reduction in a loss
contingency that had been previously expensed in 2012;
Direct operating expenses were also impacted by lower retailer revenue sharing expenses primarily due to
lower revenue, lower payment card processing fees due to fewer rentals and general cost containment
initiatives. The 2014 period also included a one-time benefit from a $5.6 million adjustment to expenses
related to personal property taxes due to a reduction of the estimated liability; and