Redbox 2014 Annual Report Download - page 90
Download and view the complete annual report
Please find page 90 of the 2014 Redbox annual report below. You can navigate through the pages in the report by either clicking on the pages listed below, or by using the keyword search tool below to find specific information within the annual report.-
 1
1 -
2
-
3
-
4
-
5
-
6
-
7
-
8
-
9
-
10
-
11
-
12
-
13
-
14
-
15
-
16
-
17
-
18
-
19
-
20
-
21
-
22
-
23
-
24
-
25
-
26
-
27
-
28
-
29
-
30
-
31
-
32
-
33
-
34
-
35
-
36
-
37
-
38
-
39
-
40
-
41
-
42
-
43
-
44
-
45
-
46
-
47
-
48
-
49
-
50
-
51
-
52
-
53
-
54
-
55
-
56
-
57
-
58
-
59
-
60
-
61
-
62
-
63
-
64
-
65
-
66
-
67
-
68
-
69
-
70
-
71
-
72
-
73
-
74
-
75
-
76
-
77
-
78
-
79
-
 80
80 -
 81
81 -
 82
82 -
 83
83 -
 84
84 -
 85
85 -
 86
86 -
 87
87 -
 88
88 -
 89
89 -
 90
90 -
 91
91 -
 92
92 -
 93
93 -
 94
94 -
 95
95 -
 96
96 -
 97
97 -
 98
98 -
 99
99 -
 100
100 -
101
-
102
-
103
-
104
-
105
-
106
-
107
-
108
-
109
-
110
-
111
-
112
-
113
-
114
-
115
-
116
-
117
-
118
-
119
-
120
-
121
-
122
-
123
-
124
-
125
-
126
 |
 |

82
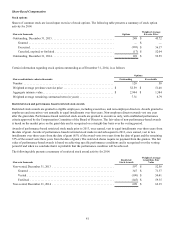
Share-Based Payments for Content Arrangements
We have granted restricted stock as part of content license agreements with certain movie studios. The expense related to these
agreements is included within direct operating expenses in our Consolidated Statements of Comprehensive Income and is
adjusted based on the number of unvested shares and market price of our common stock each reporting period. See Note 17:
Commitments and Contingencies for more information on changes in commitments to issue restricted stock for content license
agreements.
Information related to the shares of restricted stock granted as part of these agreements as of December 31, 2014, is as follows:
Whole shares Granted Vested Unvested
Remaining
Vesting Period
Sony (1) . . . . . . . . . . . . . . . . . . . . . . . . . . . . . 218,348 218,348 — N/A
Paramount (2) . . . . . . . . . . . . . . . . . . . . . . . . 300,000 255,000 45,000 one day
Total . . . . . . . . . . . . . . . . . . . . . . . . . . . 518,348 473,348 45,000
(1) Includes 25,000 shares granted and fully vested in 2014 due to one-year contract extension executed in 2014.
(2) Vested on January 1, 2015.
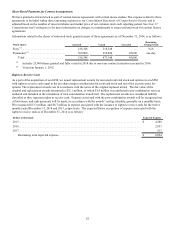
Rights to Receive Cash
As a part of the acquisition of ecoATM, we issued replacement awards for unvested restricted stock and options in ecoATM
with rights to receive cash equal to the per share merger consideration for restricted stock and net of the exercise price for
options. The replacement awards vest in accordance with the terms of the original replaced award. The fair value of the
original and replacement awards amounted to $32.1 million, of which $1.4 million was attributed to pre-combination services
rendered and included in the calculation of total consideration transferred. The replacement awards are considered liability
classified as they represent rights to receive cash. Expense associated with the post-combination awards will be recognized net
of forfeitures, and cash payments will be made, in accordance with the awards' vesting schedule, generally on a monthly basis.
We recognized $13.3 million and $8.7 million in expense associated with the issuance of rights to receive cash for the twelve
months ended December 31, 2014 and 2013, respectively. The expected future recognition of expense associated with the
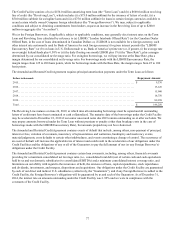
rights to receive cash as of December 31, 2014 is as follows:
Dollars in thousands Expected Expense
2015 . . . . . . . . . . . . . . . . . . . . . . . . . . . . . . . . . . . . . . . . . . . . . . . . . . . . . . . . . . . . . . . . . . . . . . . . . . . . . . . . . . . $ 4,588
2016 . . . . . . . . . . . . . . . . . . . . . . . . . . . . . . . . . . . . . . . . . . . . . . . . . . . . . . . . . . . . . . . . . . . . . . . . . . . . . . . . . . . 2,953
2017 . . . . . . . . . . . . . . . . . . . . . . . . . . . . . . . . . . . . . . . . . . . . . . . . . . . . . . . . . . . . . . . . . . . . . . . . . . . . . . . . . . . 513
Remaining total expected expense . . . . . . . . . . . . . . . . . . . . . . . . . . . . . . . . . . . . . . . . . . . . . . . . . . . . . . . . $ 8,054