Redbox 2014 Annual Report Download - page 36
Download and view the complete annual report
Please find page 36 of the 2014 Redbox annual report below. You can navigate through the pages in the report by either clicking on the pages listed below, or by using the keyword search tool below to find specific information within the annual report.-
 1
1 -
2
-
3
-
4
-
5
-
6
-
7
-
8
-
9
-
10
-
11
-
12
-
13
-
14
-
15
-
16
-
17
-
18
-
19
-
20
-
21
-
22
-
23
-
24
-
25
-
 26
26 -
 27
27 -
 28
28 -
 29
29 -
 30
30 -
 31
31 -
 32
32 -
 33
33 -
 34
34 -
 35
35 -
 36
36 -
 37
37 -
 38
38 -
 39
39 -
 40
40 -
 41
41 -
 42
42 -
 43
43 -
 44
44 -
 45
45 -
 46
46 -
47
-
48
-
49
-
50
-
51
-
52
-
53
-
54
-
55
-
56
-
57
-
58
-
59
-
60
-
61
-
62
-
63
-
64
-
65
-
66
-
67
-
68
-
69
-
70
-
71
-
72
-
73
-
74
-
75
-
76
-
77
-
78
-
79
-
80
-
81
-
82
-
83
-
84
-
85
-
86
-
87
-
88
-
89
-
90
-
91
-
92
-
93
-
94
-
95
-
96
-
97
-
98
-
99
-
100
-
101
-
102
-
103
-
104
-
105
-
106
-
107
-
108
-
109
-
110
-
111
-
112
-
113
-
114
-
115
-
116
-
117
-
118
-
119
-
120
-
121
-
122
-
123
-
124
-
125
-
126
 |
 |

28
Comparing 2013 to 2012 Continued
Increases in other direct operating expenses including revenue share, payment card processing fees, customer
service and support function costs directly attributable to our revenue and kiosk growth and certain costs
incurred to service the kiosks that were under the transition services agreement with NCR, offsetting this was
a benefit from an $11.4 million reduction in a loss contingency accrual recorded during first quarter of 2013,
of which $11.4 million had been previously expensed in 2012;
Higher depreciation and amortization expenses primarily due to higher depreciation from the continued
investment in our technology infrastructure, incremental depreciation associated with our 2012 installed
kiosks, including the NCR kiosks, as well as the launch of Redbox Instant by Verizon; and
Increased general and administrative expenses primarily due to higher expenses related to corporate
information technology initiatives including the continued implementation and maintenance of our enterprise
resource planning system and professional fees related to the sale of kiosks acquired in our NCR Asset
Acquisition.
• Increased operating income in our Coinstar segment primarily attributable to revenue growth.
Income from continuing operations increased $47.6 million, or 29.7%, primarily due to:
• A gain of $68.4 million on the re-measurement of our previously held equity interest in ecoATM during 2013;
• Lower income tax expenses due to lower pretax income and a lower effective tax rate driven primarily by a tax benefit
of $24.3 million related to the non-taxable gain upon the acquisition of ecoATM noted above, a discrete one-time tax
benefit of $17.8 million, net of a valuation allowance, related to outside tax basis from a restructuring and sale of a
subsidiary and a $16.7 million discrete one-time tax benefit related to the recognition of an outside basis difference in
a subsidiary; partially offset by
• Lower operating income as described above;
• A $19.5 million gain on a license grant to the Joint Venture during 2012 which did not recur in 2013;
• Increased interest expense primarily due to the $350.0 million in Senior Notes we issued on March 12, 2013 and loss
from early extinguishment or conversion of debt.
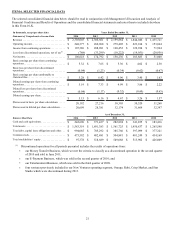
Share-Based Payments and Rights to Receive Cash
Our share-based payments consist of share-based compensation granted to executives, non-employee directors and employees
and share-based payments granted to movie studios as part of content agreements. We grant stock options, restricted stock and
performance-based restricted stock to executives and non-employee directors and restricted stock to our employees. In
connection with our acquisition of ecoATM, we also granted certain rights to receive cash (the "rights to receive cash"). We also
granted restricted stock to certain movie studios as part of content agreements with our Redbox segment. The expense
associated with the grants to movie studios is allocated to our Redbox segment and included within direct operating expenses.
The expenses associated with share-based compensation to our executives, non-employee directors, employees and related to
the rights to receive cash are part of our corporate function and are not allocated to our segments. The components of our
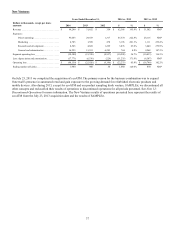
unallocated share-based compensation expense are presented in the following table:
Years Ended December 31, 2014 vs. 2013 2013 vs. 2012
Dollars in thousands, except per share
amounts 2014 2013 2012 $%$%
Direct operating . . . . . . . . . . . . . . . . . . . . . . . . . . $ 6,585 $ 3,636 $ 863 $ 2,949 81.1 % $ 2,773 321.3%
Marketing . . . . . . . . . . . . . . . . . . . . . . . . . . . . . . . 3,193 1,559 66 1,634 104.8 % 1,493 NM*
Research and development. . . . . . . . . . . . . . . . . . 3,851 1,375 334 2,476 180.1 % 1,041 311.7%
General and administrative. . . . . . . . . . . . . . . . . . 11,658 14,164 11,984 (2,506) (17.7)% 2,180 18.2%
Total. . . . . . . . . . . . . . . . . . . . . . . . . . . . . . . $ 25,287 $ 20,734 $ 13,247 $ 4,553 22.0 % $ 7,487 56.5%
* Not meaningful
Unallocated share-based compensation expense increased $4.6 million, or 22.0% and $7.5 million, or 56.5% during the years
ended December 31, 2014 and 2013, respectively, due to the rights to receive cash and changes in the fair value of restricted
stock awards granted. See Note 9: Share-Based Payments in our Notes to Consolidated Financial Statements for more
information.