Redbox 2014 Annual Report Download - page 111
Download and view the complete annual report
Please find page 111 of the 2014 Redbox annual report below. You can navigate through the pages in the report by either clicking on the pages listed below, or by using the keyword search tool below to find specific information within the annual report.-
 1
1 -
2
-
3
-
4
-
5
-
6
-
7
-
8
-
9
-
10
-
11
-
12
-
13
-
14
-
15
-
16
-
17
-
18
-
19
-
20
-
21
-
22
-
23
-
24
-
25
-
26
-
27
-
28
-
29
-
30
-
31
-
32
-
33
-
34
-
35
-
36
-
37
-
38
-
39
-
40
-
41
-
42
-
43
-
44
-
45
-
46
-
47
-
48
-
49
-
50
-
51
-
52
-
53
-
54
-
55
-
56
-
57
-
58
-
59
-
60
-
61
-
62
-
63
-
64
-
65
-
66
-
67
-
68
-
69
-
70
-
71
-
72
-
73
-
74
-
75
-
76
-
77
-
78
-
79
-
80
-
81
-
82
-
83
-
84
-
85
-
86
-
87
-
88
-
89
-
90
-
91
-
92
-
93
-
94
-
95
-
96
-
97
-
98
-
99
-
100
-
 101
101 -
 102
102 -
 103
103 -
 104
104 -
 105
105 -
 106
106 -
 107
107 -
 108
108 -
 109
109 -
 110
110 -
 111
111 -
 112
112 -
 113
113 -
 114
114 -
 115
115 -
 116
116 -
 117
117 -
 118
118 -
 119
119 -
 120
120 -
 121
121 -
122
-
123
-
124
-
125
-
126
 |
 |

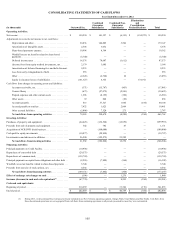
103
CONSOLIDATING STATEMENTS OF CASH FLOWS
Year Ended December 31, 2013
(in thousands) Outerwall Inc.
Combined
Guarantor
Subsidiaries
Combined Non-
Guarantor
Subsidiaries
Eliminations
and
Consolidation
Reclassifications Total
Operating Activities:
Net income (loss). . . . . . . . . . . . . . . . . . . . . . . . . . . . . . $ 174,792 $ 109,682 $ (11,037) $ (98,645) $ 174,792
Adjustments to reconcile net income to net cash flows
from operating activities:
Depreciation and other . . . . . . . . . . . . . . . . . . . . . 29,640 158,801 5,259 — 193,700
Amortization of intangible assets . . . . . . . . . . . . . 2,245 8,688 — — 10,933
Share-based payments expense . . . . . . . . . . . . . . 9,903 6,928 — — 16,831
Windfall excess tax benefits related to share-
based payments. . . . . . . . . . . . . . . . . . . . . . . . . . . (3,698) — — — (3,698)
Deferred income taxes . . . . . . . . . . . . . . . . . . . . . 9,228 (15,727) (4,434) — (10,933)
Impairment Expense. . . . . . . . . . . . . . . . . . . . . . . 32,444 288 — — 32,732
Loss (income) from equity method investments,
net . . . . . . . . . . . . . . . . . . . . . . . . . . . . . . . . . . . . . (65,063) 45,135 — — (19,928)
Amortization of deferred financing fees and debt
discount . . . . . . . . . . . . . . . . . . . . . . . . . . . . . . . . 6,394———6,394
Loss from early extinguishment of debt. . . . . . . . 6,013———6,013
Other. . . . . . . . . . . . . . . . . . . . . . . . . . . . . . . . . . . 827 (2,951) 31 54 (2,039)
Equity in (income) losses of subsidiaries . . . . . . . (109,682) 11,037 — 98,645 —
Cash flows from changes in operating assets and
liabilities:
Accounts receivable, net. . . . . . . . . . . . . . . . . . . . (1,144) 10,639 (1,517) — 7,978
Content library . . . . . . . . . . . . . . . . . . . . . . . . . . . 1,093 (23,357) (195) — (22,459)
Prepaid expenses and other current assets . . . . . . (43,762) (6,280) (500) — (50,542)
Other assets. . . . . . . . . . . . . . . . . . . . . . . . . . . . . . 201 400 (371) — 230
Accounts payable . . . . . . . . . . . . . . . . . . . . . . . . . 1,319 (408) 226 354 1,491
Accrued payable to retailers . . . . . . . . . . . . . . . . . (6,181) 1,633 460 — (4,088)
Other accrued liabilities . . . . . . . . . . . . . . . . . . . . 13,184 (22,751) (6) — (9,573)
Net cash flows from (used in) operating
activities(1) . . . . . . . . . . . . . . . . . . . . . . . . . . . . . . 57,753 281,757 (12,084) 408 327,834
Investing Activities:
Purchases of property and equipment . . . . . . . . . . . . . . (58,763) (88,431) (14,218) — (161,412)
Proceeds from sale of property and equipment . . . . . . . 12,147 1,189 8 — 13,344
Acquisition of ecoATM, net of cash acquired. . . . . . . . (244,036) — — — (244,036)
Receipt of note receivable principal . . . . . . . . . . . . . . . 22,913———22,913
Cash paid for equity investments . . . . . . . . . . . . . . . . . — (28,000) — — (28,000)
Investments in and advances to affiliates . . . . . . . . . . . 125,856 (156,659) 30,857 (54) —
Net cash flows from (used in) investing
activities(1) . . . . . . . . . . . . . . . . . . . . . . . . . . . . . . (141,883) (271,901) 16,647 (54) (397,191)
Financing Activities:
Proceeds from issuance of senior unsecured notes . . . . 343,769———343,769
Proceeds from new borrowing on Credit Facility . . . . . 400,000———400,000
Principal payments on Credit Facility . . . . . . . . . . . . . . (215,313) — — — (215,313)
Financing costs associated with Credit Facility and
senior unsecured notes. . . . . . . . . . . . . . . . . . . . . . . . . . (2,203) — — — (2,203)
Conversion of convertible debt . . . . . . . . . . . . . . . . . . . (172,211) — — — (172,211)
Repurchases of common stock . . . . . . . . . . . . . . . . . . . (195,004) — — — (195,004)
Principal payments on capital lease obligations and
other debt. . . . . . . . . . . . . . . . . . . . . . . . . . . . . . . . . . . . (14,200) (217) (417) — (14,834)
Windfall excess tax benefits related to share-based
payments . . . . . . . . . . . . . . . . . . . . . . . . . . . . . . . . . . . . 3,698———3,698
Withholding tax paid on vesting of restricted stock net
of proceeds from exercise of stock options . . . . . . . . . . 8,460———8,460
Net cash flows from (used in) financing
activities(1) . . . . . . . . . . . . . . . . . . . . . . . . . . . . . . 156,996 (217) (417) — 156,362