Redbox 2014 Annual Report Download - page 92
Download and view the complete annual report
Please find page 92 of the 2014 Redbox annual report below. You can navigate through the pages in the report by either clicking on the pages listed below, or by using the keyword search tool below to find specific information within the annual report.-
 1
1 -
2
-
3
-
4
-
5
-
6
-
7
-
8
-
9
-
10
-
11
-
12
-
13
-
14
-
15
-
16
-
17
-
18
-
19
-
20
-
21
-
22
-
23
-
24
-
25
-
26
-
27
-
28
-
29
-
30
-
31
-
32
-
33
-
34
-
35
-
36
-
37
-
38
-
39
-
40
-
41
-
42
-
43
-
44
-
45
-
46
-
47
-
48
-
49
-
50
-
51
-
52
-
53
-
54
-
55
-
56
-
57
-
58
-
59
-
60
-
61
-
62
-
63
-
64
-
65
-
66
-
67
-
68
-
69
-
70
-
71
-
72
-
73
-
74
-
75
-
76
-
77
-
78
-
79
-
80
-
81
-
 82
82 -
 83
83 -
 84
84 -
 85
85 -
 86
86 -
 87
87 -
 88
88 -
 89
89 -
 90
90 -
 91
91 -
 92
92 -
 93
93 -
 94
94 -
 95
95 -
 96
96 -
 97
97 -
 98
98 -
 99
99 -
 100
100 -
 101
101 -
 102
102 -
103
-
104
-
105
-
106
-
107
-
108
-
109
-
110
-
111
-
112
-
113
-
114
-
115
-
116
-
117
-
118
-
119
-
120
-
121
-
122
-
123
-
124
-
125
-
126
 |
 |

84
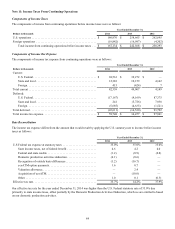
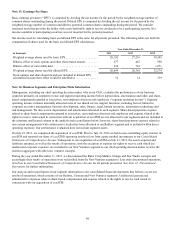
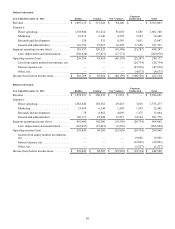
Note 11: Income Taxes From Continuing Operations
Components of Income Taxes
The components of income from continuing operations before income taxes were as follows:
Year Ended December 31,
Dollars in thousands 2014 2013 2012
U.S. operations . . . . . . . . . . . . . . . . . . . . . . . . . . . . . . . . . . . . . . . . . . . . $ 186,976 $ 258,665 $ 262,695
Foreign operations . . . . . . . . . . . . . . . . . . . . . . . . . . . . . . . . . . . . . . . . . (19,842)(16,097)(4,302)
Total income from continuing operations before income taxes . . . $ 167,134 $ 242,568 $ 258,393
Components of Income Tax Expense
The components of income tax expense from continuing operations were as follows:
Year Ended December 31,
Dollars in thousands 2014 2013 2012
Current:
U.S. Federal . . . . . . . . . . . . . . . . . . . . . . . . . . . . . . . . . . . . . . . . . . . $ 69,561 $ 39,272 $ —
State and local . . . . . . . . . . . . . . . . . . . . . . . . . . . . . . . . . . . . . . . . . 12,383 10,159 4,142
Foreign. . . . . . . . . . . . . . . . . . . . . . . . . . . . . . . . . . . . . . . . . . . . . . . 415 (424)7
Total current . . . . . . . . . . . . . . . . . . . . . . . . . . . . . . . . . . . . . . . . . . . . . . 82,359 49,007 4,149
Deferred:
U.S. Federal . . . . . . . . . . . . . . . . . . . . . . . . . . . . . . . . . . . . . . . . . . . (17,167)(4,169) 87,375
State and local . . . . . . . . . . . . . . . . . . . . . . . . . . . . . . . . . . . . . . . . . 241 (5,726) 7,938
Foreign. . . . . . . . . . . . . . . . . . . . . . . . . . . . . . . . . . . . . . . . . . . . . . . (5,685)(4,635)(1,521)
Total deferred . . . . . . . . . . . . . . . . . . . . . . . . . . . . . . . . . . . . . . . . . . . . . (22,611)(14,530) 93,792
Total income tax expense . . . . . . . . . . . . . . . . . . . . . . . . . . . . . . . . . . . . $ 59,748 $ 34,477 $ 97,941
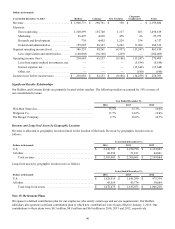
Rate Reconciliation
The income tax expense differs from the amount that would result by applying the U.S. statutory rate to income before income
taxes as follows:
Year Ended December 31,
2014 2013 2012
U.S Federal tax expense at statutory rates . . . . . . . . . . . . . . . . . . . . . . . 35.0% 35.0% 35.0%
State income taxes, net of federal benefit . . . . . . . . . . . . . . . . . . . . 4.6 4.2 4.0
Federal and state credits . . . . . . . . . . . . . . . . . . . . . . . . . . . . . . . . . (1.2)(0.9)(0.8)
Domestic production activities deduction . . . . . . . . . . . . . . . . . . . . (4.1)(0.6)—
Recognition of outside basis differences. . . . . . . . . . . . . . . . . . . . . (1.2)(16.7)—
ecoATM option payments . . . . . . . . . . . . . . . . . . . . . . . . . . . . . . . . 1.6 0.7 —
Valuation allowance. . . . . . . . . . . . . . . . . . . . . . . . . . . . . . . . . . . . . — 2.4 —
Acquisition of ecoATM. . . . . . . . . . . . . . . . . . . . . . . . . . . . . . . . . . — (10.0)—
Other . . . . . . . . . . . . . . . . . . . . . . . . . . . . . . . . . . . . . . . . . . . . . . . . 1.0 0.1 (0.3)
Effective tax rate. . . . . . . . . . . . . . . . . . . . . . . . . . . . . . . . . . . . . . . . . . . 35.7% 14.2% 37.9%
Our effective tax rate for the year ended December 31, 2014 was higher than the U.S. Federal statutory rate of 35.0% due
primarily to state income taxes, offset partially by the Domestic Production Activities Deduction, which we are entitled to based
on our domestic production activities.