Redbox 2014 Annual Report Download - page 78
Download and view the complete annual report
Please find page 78 of the 2014 Redbox annual report below. You can navigate through the pages in the report by either clicking on the pages listed below, or by using the keyword search tool below to find specific information within the annual report.-
 1
1 -
2
-
3
-
4
-
5
-
6
-
7
-
8
-
9
-
10
-
11
-
12
-
13
-
14
-
15
-
16
-
17
-
18
-
19
-
20
-
21
-
22
-
23
-
24
-
25
-
26
-
27
-
28
-
29
-
30
-
31
-
32
-
33
-
34
-
35
-
36
-
37
-
38
-
39
-
40
-
41
-
42
-
43
-
44
-
45
-
46
-
47
-
48
-
49
-
50
-
51
-
52
-
53
-
54
-
55
-
56
-
57
-
58
-
59
-
60
-
61
-
62
-
63
-
64
-
65
-
66
-
67
-
 68
68 -
 69
69 -
 70
70 -
 71
71 -
 72
72 -
 73
73 -
 74
74 -
 75
75 -
 76
76 -
 77
77 -
 78
78 -
 79
79 -
 80
80 -
 81
81 -
 82
82 -
 83
83 -
 84
84 -
 85
85 -
 86
86 -
 87
87 -
 88
88 -
89
-
90
-
91
-
92
-
93
-
94
-
95
-
96
-
97
-
98
-
99
-
100
-
101
-
102
-
103
-
104
-
105
-
106
-
107
-
108
-
109
-
110
-
111
-
112
-
113
-
114
-
115
-
116
-
117
-
118
-
119
-
120
-
121
-
122
-
123
-
124
-
125
-
126
 |
 |

70
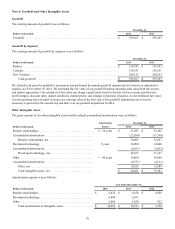
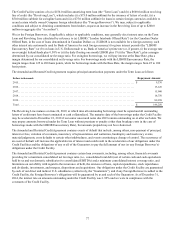
Note 4: Goodwill and Other Intangible Assets
Goodwill
The carrying amount of goodwill was as follows:
Dollars in thousands
December 31,
2014 2013
Goodwill . . . . . . . . . . . . . . . . . . . . . . . . . . . . . . . . . . . . . . . . . . . . . . . . . . . . . . . . . . . . . . . $ 559,307 $ 559,307
Goodwill by Segment
The carrying amount of goodwill by segment was as follows:
Dollars in thousands
December 31,
2014 2013
Redbox . . . . . . . . . . . . . . . . . . . . . . . . . . . . . . . . . . . . . . . . . . . . . . . . . . . . . . . . . . . . . . . . $ 138,743 $ 138,743
Coinstar. . . . . . . . . . . . . . . . . . . . . . . . . . . . . . . . . . . . . . . . . . . . . . . . . . . . . . . . . . . . . . . . 156,351 156,351
New Ventures . . . . . . . . . . . . . . . . . . . . . . . . . . . . . . . . . . . . . . . . . . . . . . . . . . . . . . . . . . . 264,213 264,213
Total goodwill . . . . . . . . . . . . . . . . . . . . . . . . . . . . . . . . . . . . . . . . . . . . . . . . . . . . . . . $ 559,307 $ 559,307
We elected to by-pass the qualitative assessment and performed the annual goodwill impairment test based on a quantitative
analysis as of November 30, 2014. We estimated the fair value of our goodwill bearing reporting units using both the income
and market approaches. Our estimates of fair value can change significantly based on factors such as revenue growth rates,
profit margins, discount rates, market conditions, market prices, and changes in business strategies. As the estimated fair value
of each reporting unit exceeded its respective carrying value in the first step of the goodwill impairment test it was not
necessary to proceed to the second step and there was no goodwill impairment in 2014.
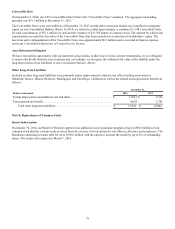
Other Intangible Assets
The gross amount of our other intangible assets and the related accumulated amortization were as follows:
Dollars in thousands
Amortization December 31,
Period 2014 2013
Retailer relationships. . . . . . . . . . . . . . . . . . . . . . . . . . . . . . . . . . . . . . 5 - 10 years $ 53,295 $ 53,295
Accumulated amortization . . . . . . . . . . . . . . . . . . . . . . . . . . . . . . . . . (23,200)(17,768)
Retailer relationships, net. . . . . . . . . . . . . . . . . . . . . . . . . . . . . . . 30,095 35,527
Developed technology. . . . . . . . . . . . . . . . . . . . . . . . . . . . . . . . . . . . . 5 years 34,000 34,000
Accumulated amortization . . . . . . . . . . . . . . . . . . . . . . . . . . . . . . . . . (9,633)(2,833)
Developed technology, net. . . . . . . . . . . . . . . . . . . . . . . . . . . . . . 24,367 31,167
Other . . . . . . . . . . . . . . . . . . . . . . . . . . . . . . . . . . . . . . . . . . . . . . . . . . 1 - 40 years 16,800 16,800
Accumulated amortization . . . . . . . . . . . . . . . . . . . . . . . . . . . . . . . . . (6,571)(4,111)
Other, net . . . . . . . . . . . . . . . . . . . . . . . . . . . . . . . . . . . . . . . . . . . 10,229 12,689
Total intangible assets, net. . . . . . . . . . . . . . . . . . . . . . . . . . . . . . $ 64,691 $ 79,383
Amortization expense was as follows:
Year Ended December 31,
Dollars in thousands 2014 2013 2012
Retailer relationships. . . . . . . . . . . . . . . . . . . . . . . . . . . . . . . . . . . . . . $ 5,432 $ 6,250 $ 4,456
Developed technology. . . . . . . . . . . . . . . . . . . . . . . . . . . . . . . . . . . . . 6,800 2,833 —
Other . . . . . . . . . . . . . . . . . . . . . . . . . . . . . . . . . . . . . . . . . . . . . . . . . . 2,460 1,850 922
Total amortization of intangible assets . . . . . . . . . . . . . . . . . . . . $ 14,692 $ 10,933 $ 5,378