Redbox 2014 Annual Report Download - page 37
Download and view the complete annual report
Please find page 37 of the 2014 Redbox annual report below. You can navigate through the pages in the report by either clicking on the pages listed below, or by using the keyword search tool below to find specific information within the annual report.-
 1
1 -
2
-
3
-
4
-
5
-
6
-
7
-
8
-
9
-
10
-
11
-
12
-
13
-
14
-
15
-
16
-
17
-
18
-
19
-
20
-
21
-
22
-
23
-
24
-
25
-
26
-
 27
27 -
 28
28 -
 29
29 -
 30
30 -
 31
31 -
 32
32 -
 33
33 -
 34
34 -
 35
35 -
 36
36 -
 37
37 -
 38
38 -
 39
39 -
 40
40 -
 41
41 -
 42
42 -
 43
43 -
 44
44 -
 45
45 -
 46
46 -
 47
47 -
48
-
49
-
50
-
51
-
52
-
53
-
54
-
55
-
56
-
57
-
58
-
59
-
60
-
61
-
62
-
63
-
64
-
65
-
66
-
67
-
68
-
69
-
70
-
71
-
72
-
73
-
74
-
75
-
76
-
77
-
78
-
79
-
80
-
81
-
82
-
83
-
84
-
85
-
86
-
87
-
88
-
89
-
90
-
91
-
92
-
93
-
94
-
95
-
96
-
97
-
98
-
99
-
100
-
101
-
102
-
103
-
104
-
105
-
106
-
107
-
108
-
109
-
110
-
111
-
112
-
113
-
114
-
115
-
116
-
117
-
118
-
119
-
120
-
121
-
122
-
123
-
124
-
125
-
126
 |
 |
29
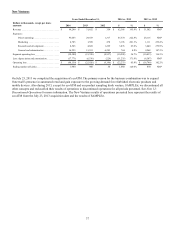
Segment Results
Our discussion and analysis that follows covers results of operations for our Redbox, Coinstar and New Ventures segments.
We manage our business by evaluating the financial results of our segments, focusing primarily on segment revenue and
segment operating income before depreciation, amortization and other; share-based compensation granted to executives, non-
employee directors and employees and the rights to receive cash (“segment operating income”). Segment operating income
contains internally allocated costs of our shared services support functions, including but not limited to, corporate executive
management, business development, sales, customer service, finance, legal, human resources, information technology, and risk
management. We also review depreciation and amortization allocated to each segment.
Management utilizes segment revenue and segment operating income to evaluate the health of our business segments and in
consideration of allocating resources among our business segments. Specifically, our CEO evaluates segment revenue and
segment operating income, and assesses the performance of each business segment based on these measures, as well as, among
other things, the prospects of each of the segments and how they fit into our overall strategy. Our CEO then decides how
resources should be allocated among our business segments. For example, if a segment’s revenue increases more than expected,
our CEO may consider allocating more financial or other resources to that segment in the future. We periodically evaluate our
shared services support function’s allocation methods used for segment reporting purposes, which may result in changes to
segment allocations in future periods.
We also review same store sales, which we calculate for our segments on a location basis. Most of our locations have a single
kiosk, but in locations with a high-performing kiosk, we may add additional kiosks to drive incremental revenue and provide a
broader product offering. Same store sales reflects the change in revenue from locations that have been operating for more than
13 months by the end of the reporting period compared with the same locations in the same period of the prior year. The same
store sales metric is not applicable to our ecoATM business because transactions at the kiosk are for product acquisition, not
sales.
Detailed financial information about our business segments, including significant customer relationships is provided in Note 14:
Business Segments and Enterprise-Wide Information in our Notes to Consolidated Financial Statements.