Redbox 2014 Annual Report Download - page 52
Download and view the complete annual report
Please find page 52 of the 2014 Redbox annual report below. You can navigate through the pages in the report by either clicking on the pages listed below, or by using the keyword search tool below to find specific information within the annual report.-
 1
1 -
2
-
3
-
4
-
5
-
6
-
7
-
8
-
9
-
10
-
11
-
12
-
13
-
14
-
15
-
16
-
17
-
18
-
19
-
20
-
21
-
22
-
23
-
24
-
25
-
26
-
27
-
28
-
29
-
30
-
31
-
32
-
33
-
34
-
35
-
36
-
37
-
38
-
39
-
40
-
41
-
 42
42 -
 43
43 -
 44
44 -
 45
45 -
 46
46 -
 47
47 -
 48
48 -
 49
49 -
 50
50 -
 51
51 -
 52
52 -
 53
53 -
 54
54 -
 55
55 -
 56
56 -
 57
57 -
 58
58 -
 59
59 -
 60
60 -
 61
61 -
 62
62 -
63
-
64
-
65
-
66
-
67
-
68
-
69
-
70
-
71
-
72
-
73
-
74
-
75
-
76
-
77
-
78
-
79
-
80
-
81
-
82
-
83
-
84
-
85
-
86
-
87
-
88
-
89
-
90
-
91
-
92
-
93
-
94
-
95
-
96
-
97
-
98
-
99
-
100
-
101
-
102
-
103
-
104
-
105
-
106
-
107
-
108
-
109
-
110
-
111
-
112
-
113
-
114
-
115
-
116
-
117
-
118
-
119
-
120
-
121
-
122
-
123
-
124
-
125
-
126
 |
 |

44
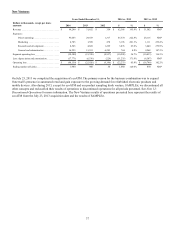
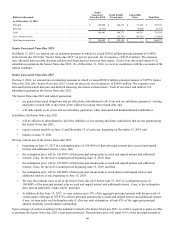
Net Debt and Net Leverage Ratio
Our non-GAAP financial measure net debt is defined as the total face value of outstanding debt, including capital leases, less
cash and cash equivalents held in financial institutions domestically. Our non-GAAP financial measure net leverage ratio is
defined as net debt divided by core adjusted EBITDA from continuing operations for the last twelve months ("LTM"). We
believe net debt and net leverage ratio are important non-GAAP measures because they:
• are used to assess the degree of leverage by management;
• provide additional information to users of the financial statements regarding our ability to service, incur or pay down
indebtedness and repurchase our securities as well as additional information about our capital structure; and
• are reported quarterly to support covenant compliance under our credit agreement.
A reconciliation of net debt to total outstanding debt including capital leases, the most comparable GAAP financial measure, is
presented in the following table:
December 31, Change
Dollars in thousands 2014 2013 $ %
Senior unsecured notes(1) . . . . . . . . . . . . . . . . . . . . . . . . . . . . . . . . . . . . . . . . . . . . . . . . . . . . . . . . $ 650,000 $ 350,000 $ 300,000 85.7 %
Term loans(1). . . . . . . . . . . . . . . . . . . . . . . . . . . . . . . . . . . . . . . . . . . . . . . . . . . . . . . . . . . . . . . . . . 146,250 344,375 (198,125) (57.5)%
Revolving line of credit . . . . . . . . . . . . . . . . . . . . . . . . . . . . . . . . . . . . . . . . . . . . . . . . . . . . . . . . . 160,000 — 160,000 NM*
Convertible debt(1) . . . . . . . . . . . . . . . . . . . . . . . . . . . . . . . . . . . . . . . . . . . . . . . . . . . . . . . . . . . . . — 51,148 (51,148) (100.0)%
Capital leases . . . . . . . . . . . . . . . . . . . . . . . . . . . . . . . . . . . . . . . . . . . . . . . . . . . . . . . . . . . . . . . . . 15,391 21,361 (5,970) (27.9)%
Total principal value of outstanding debt including capital leases . . . . . . . . . . . . . . . . . . . . . 971,641 766,884 204,757 26.7 %
Less domestic cash and cash equivalents held in financial institutions. . . . . . . . . . . . . . . . . . . . . (66,546) (199,027) 132,481 (66.6)%
Net debt . . . . . . . . . . . . . . . . . . . . . . . . . . . . . . . . . . . . . . . . . . . . . . . . . . . . . . . . . . . . . . . . . . 905,095 567,857 337,238 59.4 %
LTM Core adjusted EBITDA from continuing operations . . . . . . . . . . . . . . . . . . . . . . . . . . . . . . $ 480,497 $ 491,652 $ (11,155) (2.3)%
Net leverage ratio. . . . . . . . . . . . . . . . . . . . . . . . . . . . . . . . . . . . . . . . . . . . . . . . . . . . . . . . . . . . . . 1.88 1.15
* Not Meaningful
(1) See debt section of Liquidity and Capital Resources below and Note 7: Debt and Other Long-Term Liabilities in our
Notes to Consolidated Financial Statements for detail of associated debt discount.
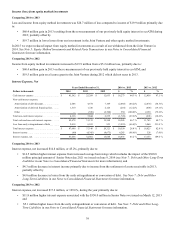
Liquidity and Capital Resources
We believe our existing cash, cash equivalents and amounts available to us under our Credit Facility will be sufficient to fund
our cash requirements and capital expenditure needs for at least the next 12 months. After that time, the extent of additional
financing needed, if any, will depend on the success of our business. If we significantly increase kiosk installations beyond
planned levels or if our Redbox, Coinstar or New Venture kiosks generate lower than anticipated revenue or operating results,
then our cash needs may increase. Furthermore, our future capital requirements will depend on a number of factors, including
consumer use of our services, the timing and number of machine installations, the number of available installable kiosks, the
type and scope of service enhancements, the cost of developing potential new product service offerings, and enhancements, and
cash required to fund potential future acquisitions, investment or capital returns to shareholders such as through share
repurchases.