Redbox 2014 Annual Report Download - page 39
Download and view the complete annual report
Please find page 39 of the 2014 Redbox annual report below. You can navigate through the pages in the report by either clicking on the pages listed below, or by using the keyword search tool below to find specific information within the annual report.-
 1
1 -
2
-
3
-
4
-
5
-
6
-
7
-
8
-
9
-
10
-
11
-
12
-
13
-
14
-
15
-
16
-
17
-
18
-
19
-
20
-
21
-
22
-
23
-
24
-
25
-
26
-
27
-
28
-
 29
29 -
 30
30 -
 31
31 -
 32
32 -
 33
33 -
 34
34 -
 35
35 -
 36
36 -
 37
37 -
 38
38 -
 39
39 -
 40
40 -
 41
41 -
 42
42 -
 43
43 -
 44
44 -
 45
45 -
 46
46 -
 47
47 -
 48
48 -
 49
49 -
50
-
51
-
52
-
53
-
54
-
55
-
56
-
57
-
58
-
59
-
60
-
61
-
62
-
63
-
64
-
65
-
66
-
67
-
68
-
69
-
70
-
71
-
72
-
73
-
74
-
75
-
76
-
77
-
78
-
79
-
80
-
81
-
82
-
83
-
84
-
85
-
86
-
87
-
88
-
89
-
90
-
91
-
92
-
93
-
94
-
95
-
96
-
97
-
98
-
99
-
100
-
101
-
102
-
103
-
104
-
105
-
106
-
107
-
108
-
109
-
110
-
111
-
112
-
113
-
114
-
115
-
116
-
117
-
118
-
119
-
120
-
121
-
122
-
123
-
124
-
125
-
126
 |
 |

31
Redbox
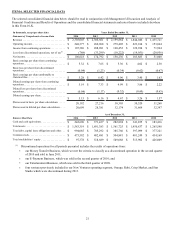
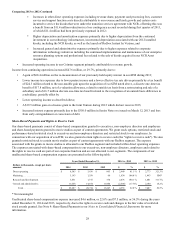
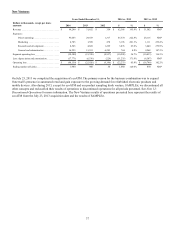
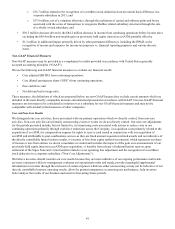
Years Ended December 31, 2014 vs. 2013 2013 vs. 2012
Dollars in thousands, except per share
amounts 2014 2013 2012 $%$%
Revenue . . . . . . . . . . . . . . . . . . . . . . . . . . . . . . . . $ 1,893,135 $ 1,974,531 $ 1,908,773 $ (81,396) (4.1)% $ 65,758 3.4 %
Expenses: . . . . . . . . . . . . . . . . . . . . . . . . . . . . . . .
Direct operating. . . . . . . . . . . . . . . . . . . . . . 1,338,946 1,383,646 1,340,899 (44,700) (3.2)% 42,747 3.2 %
Marketing . . . . . . . . . . . . . . . . . . . . . . . . . . 23,916 23,010 20,497 906 3.9 % 2,513 12.3 %
Research and development . . . . . . . . . . . . . 120 78 739 42 53.8 % (661) (89.4)%
General and administrative . . . . . . . . . . . . . 136,756 166,117 159,885 (29,361) (17.7)% 6,232 3.9 %
Segment operating income . . . . . . . . . . . . . . . . . . 393,397 401,680 386,753 (8,283) (2.1)% 14,927 3.9 %
Less: depreciation and amortization. . . . . . . . . . . (156,628) (162,637) (148,068) 6,009 (3.7)% (14,569) 9.8 %
Operating income . . . . . . . . . . . . . . . . . . . . . . . . . $ 236,769 $ 239,043 $ 238,685 $ (2,274) (1.0)% $ 358 0.1 %
Operating income as a percentage of revenue . . . 12.5 % 12.1 % 12.5%
Same store sales growth (decline) . . . . . . . . . . . . (4.9)% (4.1)% 10.2%
Effect on change in revenue from same store
sales growth (decline). . . . . . . . . . . . . . . . . . . . . . $ (95,771) $ (75,855) $ 157,711 $ (19,916) 26.3 % $ (233,566) (148.1)%
Ending number of kiosks* . . . . . . . . . . . . . . . . . . 43,680 44,000 43,700 (320) (0.7)% 300 0.7 %
Total rentals (in thousands)* . . . . . . . . . . . . . . . . 722,745 775,742 739,761 (52,997) (6.8)% 35,981 4.9 %
Net revenue per rental . . . . . . . . . . . . . . . . . . . . . $ 2.62 $ 2.54 $ 2.55 $ 0.08 3.1 % $ (0.01) (0.4)%
* Excludes kiosks and the impact of kiosks acquired as part of the 2012 NCR Asset Acquisition which occurred on
June 22, 2012. We acquired approximately 6,200 active kiosks. Approximately 1,900 of these kiosks remained in
service at December 31, 2012. During the first quarter of 2013, we replaced 100 of these kiosks with Redbox kiosks
and during the first and second quarters of 2013, we removed but did not replace all remaining kiosks acquired. During
the years ended December 31, 2013 and 2012, kiosks acquired as part of the NCR acquisition generated revenue of
approximately $2.7 million from 0.8 million rentals and $22.0 million from 7.4 million rentals, respectively.
The comparable performance of our content library is continually affected by seasonality, strength of box office and timing of
the release slate and the relative attractiveness of titles available for rent in a particular quarter or year which may have
lingering effects in subsequent periods. Compared with prior periods when kiosk installations were increasing and helping
drive growth, Redbox revenue and other operating results may be more affected by these factors. We also anticipate negative
impacts in future periods arising from the expected secular decline in the physical rental market.
2014 Events
• On November 24, 2014, Redbox announced that, effective December 2, 2014, the rental price for DVDs would
increase by 30 cents to $1.50 a day, and the price for Blu-ray Discs would increase by 50 cents to $2.00 a day; and
that, effective January 6, 2015, the rental price for video games would increase by $1.00 to $3.00 a day.
• During the fourth quarter of 2014, Redbox launched Redbox Play Pass, a new loyalty program, which we expect to
drive continued improvement in customer engagement and rental frequency.
• On November 20, 2014 Redbox announced a contract extension with Paramount Home Entertainment under the
existing terms. The one-year extension maintains day-and-date access for our customers to Paramount titles through
the end of 2015.
• On October 27, 2014, Redbox entered into a new content license agreement with Lions Gate Films, Inc. which extends
the term of the existing agreement through September 30, 2016 and can be extended for an additional year under
certain circumstances.
• On October 19, 2014, Redbox entered into an agreement with Verizon to withdraw from the Joint Venture
• On September 26, 2014, Universal Studios Home Entertainment LLC exercised its option to extend the term of the
revenue sharing license agreement between Redbox and Universal through December 31, 2015.
• On June 27, 2014, Sony notified us of their intent to extend our existing content license agreement with them. The
extension became effective October 1, 2014 and extended the license period through September 30, 2015.