Redbox 2014 Annual Report Download - page 61
Download and view the complete annual report
Please find page 61 of the 2014 Redbox annual report below. You can navigate through the pages in the report by either clicking on the pages listed below, or by using the keyword search tool below to find specific information within the annual report.-
 1
1 -
2
-
3
-
4
-
5
-
6
-
7
-
8
-
9
-
10
-
11
-
12
-
13
-
14
-
15
-
16
-
17
-
18
-
19
-
20
-
21
-
22
-
23
-
24
-
25
-
26
-
27
-
28
-
29
-
30
-
31
-
32
-
33
-
34
-
35
-
36
-
37
-
38
-
39
-
40
-
41
-
42
-
43
-
44
-
45
-
46
-
47
-
48
-
49
-
50
-
 51
51 -
 52
52 -
 53
53 -
 54
54 -
 55
55 -
 56
56 -
 57
57 -
 58
58 -
 59
59 -
 60
60 -
 61
61 -
 62
62 -
 63
63 -
 64
64 -
 65
65 -
 66
66 -
 67
67 -
 68
68 -
 69
69 -
 70
70 -
 71
71 -
72
-
73
-
74
-
75
-
76
-
77
-
78
-
79
-
80
-
81
-
82
-
83
-
84
-
85
-
86
-
87
-
88
-
89
-
90
-
91
-
92
-
93
-
94
-
95
-
96
-
97
-
98
-
99
-
100
-
101
-
102
-
103
-
104
-
105
-
106
-
107
-
108
-
109
-
110
-
111
-
112
-
113
-
114
-
115
-
116
-
117
-
118
-
119
-
120
-
121
-
122
-
123
-
124
-
125
-
126
 |
 |

53
ITEM 8. FINANCIAL STATEMENTS AND SUPPLEMENTARY DATA
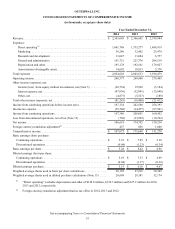
Unaudited quarterly financial data for each of the eight quarters in the two-year period ended December 31, 2014 is as follows:
2014 (In thousands, except per share data) 1st Quarter 2nd Quarter 3rd Quarter 4th Quarter
Revenue . . . . . . . . . . . . . . . . . . . . . . . . . . . . . . . . . . . . . . . . . . . . $ 600,369 $ 549,170 $ 552,864 $ 600,600
Income from continuing operations before income taxes . . . . . . $ 37,962 $ 27,347 $ 29,731 $ 72,094
Income tax expense . . . . . . . . . . . . . . . . . . . . . . . . . . . . . . . . . . . (14,076) (5,537) (11,841) (28,294)
Income from continuing operations . . . . . . . . . . . . . . . . . . . . . . . 23,886 21,810 17,890 43,800
Loss from discontinued operations, net of tax . . . . . . . . . . . . . . . (711) (57) — —
Net income . . . . . . . . . . . . . . . . . . . . . . . . . . . . . . . . . . . . . . . . . . $ 23,175 $ 21,753 $ 17,890 $ 43,800
Basic earnings per share from continuing operations . . . . . . . . . $ 1.00 $ 1.12 $ 0.95 $ 2.38
Basic loss per share from discontinued operations . . . . . . . . . . . (0.03) — — —
Basic earnings per share. . . . . . . . . . . . . . . . . . . . . . . . . . . . . . . . $ 0.97 $ 1.12 $ 0.95 $ 2.38
Diluted income per share from continuing operations. . . . . . . . . $ 0.96 $ 1.08 $ 0.93 $ 2.35
Diluted loss per share from discontinued operations . . . . . . . . . . (0.02) — — —
Diluted earnings per share . . . . . . . . . . . . . . . . . . . . . . . . . . . . . . $ 0.94 $ 1.08 $ 0.93 $ 2.35
Shares used in basic per share calculations . . . . . . . . . . . . . . . . . 23,944 19,541 18,798 18,412
Shares used in diluted per share calculations. . . . . . . . . . . . . . . . 24,775 20,181 19,147 18,660
2013 (In thousands, except per share data) 1st Quarter 2nd Quarter 3rd Quarter 4th Quarter
Revenue . . . . . . . . . . . . . . . . . . . . . . . . . . . . . . . . . . . . . . . . . . . . $ 573,307 $ 553,050 $ 586,539 $ 593,705
Income from continuing operations before income taxes . . . . . . $ 44,162 $ 53,495 $ 102,324 $ 42,587
Income tax benefit (expense) . . . . . . . . . . . . . . . . . . . . . . . . . . . . (16,155) (3,082) (15,529) 289
Income from continuing operations . . . . . . . . . . . . . . . . . . . . . . . 28,007 50,413 86,795 42,876
Loss from discontinued operations, net of tax . . . . . . . . . . . . . . . (5,403) (3,556) (4,139) (20,201)
Net income(1) . . . . . . . . . . . . . . . . . . . . . . . . . . . . . . . . . . . . . . . . $ 22,604 $ 46,857 $ 82,656 $ 22,675
Basic earnings per share from continuing operations . . . . . . . . . $ 1.02 $ 1.84 $ 3.19 $ 1.61
Basic loss per share from discontinued operations . . . . . . . . . . . (0.20) (0.13) (0.16) (0.76)
Basic earnings per share. . . . . . . . . . . . . . . . . . . . . . . . . . . . . . . . $ 0.82 $ 1.71 $ 3.03 $ 0.85
Diluted earnings per share from continuing operations . . . . . . . . $ 0.97 $ 1.77 $ 3.10 $ 1.55
Diluted loss per share from discontinued operations . . . . . . . . . . (0.19) (0.13) (0.15) (0.73)
Diluted earnings per share . . . . . . . . . . . . . . . . . . . . . . . . . . . . . . $ 0.78 $ 1.64 $ 2.95 $ 0.82
Shares used in basic per share calculations . . . . . . . . . . . . . . . . . 27,493 27,438 27,244 26,696
Shares used in diluted per share calculations. . . . . . . . . . . . . . . . 28,937 28,537 28,016 27,598
(1) Net income in the third quarter of 2013 includes a $68.4 million gain on the re-measurement of our previously held
equity interest in ecoATM to its acquisition date fair value.