Pizza Hut 1999 Annual Report Download - page 67
Download and view the complete annual report
Please find page 67 of the 1999 Pizza Hut annual report below. You can navigate through the pages in the report by either clicking on the pages listed below, or by using the keyword search tool below to find specific information within the annual report.-
 1
1 -
2
-
3
-
4
-
5
-
6
-
7
-
8
-
9
-
10
-
11
-
12
-
13
-
14
-
15
-
16
-
17
-
18
-
19
-
20
-
21
-
22
-
23
-
24
-
25
-
26
-
27
-
28
-
29
-
30
-
31
-
32
-
33
-
34
-
35
-
36
-
37
-
38
-
39
-
40
-
41
-
42
-
43
-
44
-
45
-
46
-
47
-
48
-
49
-
50
-
51
-
52
-
53
-
54
-
55
-
56
-
 57
57 -
 58
58 -
 59
59 -
 60
60 -
 61
61 -
 62
62 -
 63
63 -
 64
64 -
 65
65 -
 66
66 -
 67
67 -
 68
68 -
 69
69 -
 70
70 -
 71
71 -
 72
72
 |
 |

65
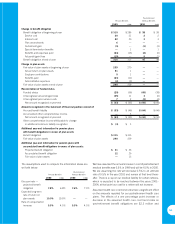
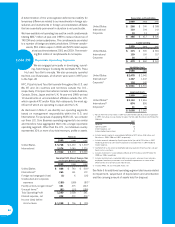
Selected Quarterly Financial Data (Unaudited)
1999
First Second Third Fourth
Quarter Quarter Quarter Quarter Total
Revenues:
Company sales $ 1,662 $ 1,723 $ 1,639 $ 2,075 $ 7,099
Franchise and license fees 151 163 173 236 723
Total revenues 1,813 1,886 1,812 2,311 7,822
Total costs and expenses 1,577 1,537 1,435 2,033 6,582
Operating profit 236 349 377 278 1,240
Net income 106 179 197 145 627
Diluted earnings per common share 0.66 1.10 1.23 0.93 3.92
Operating profit (loss) attributable to:
Accounting changes 10 6 5 8 29
Facility actions net gain 34 133 144 70 381
Unusual items — (4) (3) (44) (51)
Net income (loss) attributable to:
Accounting changes 643518
Facility actions net gain 19 80 84 43 226
Unusual items — (2) (3) (24) (29)
1998
First Second Third Fourth
Quarter Quarter Quarter Quarter Total
Revenues:
Company sales $ 1,790 $ 1,867 $ 1,869 $ 2,326 $ 7,852
Franchise and license fees 132 140 152 203 627
Total revenues 1,922 2,007 2,021 2,529 8,479
Total costs and expenses 1,754 1,745 1,742 2,210 7,451
Operating profit 168 262 279 319 1,028
Net income 54 112 128 151 445
Diluted earnings per common share 0.35 0.72 0.82 0.95 2.84
Operating profit (loss) attributable to:
Facility actions net gain 29 73 54 119 275
Unusual items — — 5 (20) (15)
Net income (loss) attributable to:
Facility actions net gain 16 42 34 70 162
Unusual items — — 3 (6) (3)
See Note 5 for details of 1999 accounting changes, facility actions net gain (loss) and unusual items.
note 23