Pizza Hut 1999 Annual Report Download - page 32
Download and view the complete annual report
Please find page 32 of the 1999 Pizza Hut annual report below. You can navigate through the pages in the report by either clicking on the pages listed below, or by using the keyword search tool below to find specific information within the annual report.-
 1
1 -
2
-
3
-
4
-
5
-
6
-
7
-
8
-
9
-
10
-
11
-
12
-
13
-
14
-
15
-
16
-
17
-
18
-
19
-
20
-
21
-
 22
22 -
 23
23 -
 24
24 -
 25
25 -
 26
26 -
 27
27 -
 28
28 -
 29
29 -
 30
30 -
 31
31 -
 32
32 -
 33
33 -
 34
34 -
 35
35 -
 36
36 -
 37
37 -
 38
38 -
 39
39 -
 40
40 -
 41
41 -
 42
42 -
43
-
44
-
45
-
46
-
47
-
48
-
49
-
50
-
51
-
52
-
53
-
54
-
55
-
56
-
57
-
58
-
59
-
60
-
61
-
62
-
63
-
64
-
65
-
66
-
67
-
68
-
69
-
70
-
71
-
72
 |
 |

The 1999 ongoing effective tax rate decreased 3.0 points to
39.3%. The decrease in the ongoing effective tax rate was pri-
marily due to a one-time favorable international benefit in
Mexico. The recent pattern of profitability in Mexico and expec-
tations of future profitability have allowed us to reverse a
previous valuation allowance against deferred tax assets. This
will allow us to reduce future cash tax payments in Mexico.
The 1998 ongoing effective tax rate decreased 2.9 points to
42.3%. The decrease in the 1998 ongoing effective tax rate was
primarily due to favorable adjustments related to prior years.
The effective tax rate attributable to foreign operations varied
from year-to-year but in each year was higher than the
U.S. federal statutory tax rate. This was primarily due to foreign
tax rate differentials, including foreign withholding tax paid
without benefit of the related foreign tax credit for U.S. income
tax purposes and losses of foreign operations for which no tax
benefit could be currently recognized.
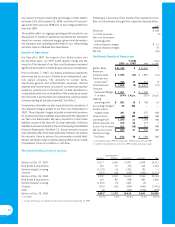
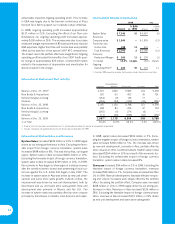
Diluted Earnings Per Share
The components of diluted earnings per common share
(“EPS”) were as follows:
Diluted(a) Basic Diluted(a) Basic
1999 1999 1998 1998
Ongoing operating
earnings $ 2.58 $ 2.69 $ 1.83 $ 1.88
Accounting changes 0.11 0.12 ——
Facility actions
net gain(b) 1.41 1.47 1.03 1.06
Unusual items(c) (0.18) (0.19) (0.02) (0.02)
Total $ 3.92 $ 4.09 $ 2.84 $ 2.92
(a) Based on 160 million shares in 1999 and 156 million shares in 1998 applicable to
diluted earnings. See Note 4.
(b) Includes favorable adjustments to our 1997 fourth quarter charge of $0.06 and $0.21
per diluted share in 1999 and 1998, respectively.
(c) Includes favorable adjustments to our 1997 fourth quarter charge of $0.07 and $0.04
per diluted share in 1999 and 1998, respectively.
U.S. Results of Operations
% B(W) % B(W)
1999 vs. 1998 1998 vs. 1997
System Sales $ 14,516 4 $ 14,013 4
Revenues
Company sales $ 5,253 (13) $ 6,013 (14)
Franchise and
license fees(1) 495 16 426 13
Total Revenues $ 5,748 (11) $ 6,439 (13)
Company
Restaurant Margin $ 825 1 $ 819 —
% of sales 15.7% 2.1 ppts)
.13.6% 1.9 ppts)
.
Ongoing
Operating Profit(2) $ 813 10 $ 740 23
(1) Excluding the special 1997 KFC renewal fees, 1998 increased 21% over 1997.
(2) Excludes 1999 accounting changes, facility actions net gain (loss) and unusual items.
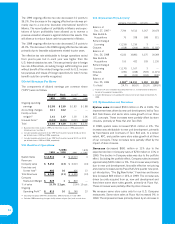
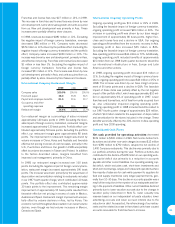
U.S. Restaurant Unit Activity
Company Franchisees Licensees Total
Balance at
Dec. 27, 1997(a) 7,794 9,512 3,167 20,473
New Builds &
Acquisitions 75 338 508 921
Refranchising &
Licensing (1,219) 1,216 3 —
Closures (418) (204) (403) (1,025)
Balance at
Dec. 26, 1998 6,232 10,862 3,275 20,369
New Builds &
Acquisitions 155 432 539 1,126
Refranchising &
Licensing (1,170) 1,167 3 —
Closures (230) (248) (593) (1,071)
Other (3) (103) (124) (230)
Balance at
Dec. 25, 1999 4,984(b) 12,110 3,100 20,194
% of total 24.7% 60.0% 15.3% 100.0%
(a) A total of 114 units have been reclassified from the U.S. to International to reflect the
transfer of management responsibility.
(b) Includes 36 Company units approved for closure, but not yet closed at December 25,
1999.
U.S. System Sales and Revenues
System sales increased $503 million or 4% in 1999. The
improvement was driven by new unit development, led by Taco
Bell franchisees and same store sales growth at our three
U.S. concepts. These increases were partially offset by store
closures, primarily at Pizza Hut and Taco Bell.
In 1998, system sales increased $511 million or 4%. The
increase was attributable to new unit development, primarily
by franchisees and licensees of Taco Bell and, to a lesser
extent, KFC, and positive same store sales growth at all three
of our concepts. These increases were partially offset by the
impact of store closures.
Revenues decreased $691 million or 11% due to the
expected decline in Company sales of $760 million or 13% in
1999. The decline in Company sales was due to the portfolio
effect. Excluding the portfolio effect, Company sales increased
approximately $305 million or 6%. This increase was primarily
due to new unit development, favorable effective net pricing
and volume increases led by Pizza Hut’s first quarter new prod-
uct introduction, “The Big New Yorker.” Franchise and license
fees increased $69 million or 16% in 1999. The increase was
driven by units acquired from us, new unit development and
franchisee same store sales growth, primarily at Pizza Hut.
These increases were partially offset by store closures.
We measure same store sales only for our U.S. Company
restaurants. Same store sales at Pizza Hut increased 9% in
1999. The improvement was primarily driven by an increase in
30