Pizza Hut 1999 Annual Report Download - page 59
Download and view the complete annual report
Please find page 59 of the 1999 Pizza Hut annual report below. You can navigate through the pages in the report by either clicking on the pages listed below, or by using the keyword search tool below to find specific information within the annual report.-
 1
1 -
2
-
3
-
4
-
5
-
6
-
7
-
8
-
9
-
10
-
11
-
12
-
13
-
14
-
15
-
16
-
17
-
18
-
19
-
20
-
21
-
22
-
23
-
24
-
25
-
26
-
27
-
28
-
29
-
30
-
31
-
32
-
33
-
34
-
35
-
36
-
37
-
38
-
39
-
40
-
41
-
42
-
43
-
44
-
45
-
46
-
47
-
48
-
 49
49 -
 50
50 -
 51
51 -
 52
52 -
 53
53 -
 54
54 -
 55
55 -
 56
56 -
 57
57 -
 58
58 -
 59
59 -
 60
60 -
 61
61 -
 62
62 -
 63
63 -
 64
64 -
 65
65 -
 66
66 -
 67
67 -
 68
68 -
 69
69 -
70
-
71
-
72
 |
 |

57
In November 1997, we granted two awards of performance
restricted stock units of TRICON’s Common Stock to our CEO.
The awards were made under the 1997 LTIP and may be paid
in Common Stock of TRICON or cash at the discretion of the
Board of Directors. Payments of the awards of $2.7 million and
$3.6 million are contingent upon the CEO’s continued employ-
ment through January 25, 2001 and 2006, respectively, and
our attainment of certain pre-established earnings thresholds,
as defined. We expense these awards over the performance
periods stipulated above; the amount included in earnings for
both 1999 and 1998 was $1.3 million and the amount for 1997
was insignificant.
During 1999, modifications of certain 1997 LTIP and Share-
Power options held by terminated employees were made.
These modifications resulted in additional compensation
expense of $5.0 million in 1999 with a corresponding
increase in our Common Stock account.
Other Compensation and
Benefit Programs
We sponsor two deferred compensation benefit
programs, the Executive Income Deferral Program and
the Restaurant Deferred Compensation Plan (the “EID Plan”
and the “RDC Plan,” respectively) for eligible employees and
non-employee directors. These plans allow participants to defer
receipt of all or a portion of their annual salary and incentive
compensation. As defined by the benefit programs, we credit
the amounts deferred with earnings based on certain invest-
ment options selected by the participants.
In late 1997, we introduced a new investment option for the
EID Plan allowing participants to defer certain incentive com-
pensation into the purchase of phantom shares of our Common
Stock at a 25% discount from the average market price at the
date of deferral (the “Discount Stock Account”). Participants
bear the risk of forfeiture of both the discount and any amounts
deferred if they voluntarily separate from employment during
the two year vesting period. We expense the intrinsic value of
the discount over the vesting period.
We are phasing in certain program changes to the EID Plan
during 1999 and 2000. These changes include limiting invest-
ment options, primarily to phantom shares of our Common
Stock, and requiring the distribution of investments in the
TRICON Common Stock investment options to be paid in
shares of our Common Stock. Due to these changes, in 1998
we agreed to credit to their accounts a one time premium on
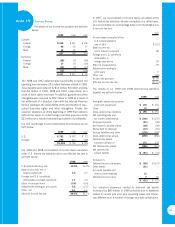
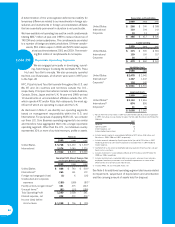
A summary of the status of all options granted to employees and non-employee directors as of December 25, 1999, December 26,
1998 and December 27, 1997, and changes during the years then ended is presented below (tabular options in thousands):
December 25, 1999 December 26, 1998 December 27, 1997
Wtd. Avg. Wtd. Avg. Wtd. Avg.
Options Exercise Price Options Exercise Price Options Exercise Price
Outstanding at beginning of year 22,699 $ 26.16 15,245 $ 23.03 — $ —
Conversion of PepsiCo options ——— — 13,951 21.48
Granted at price equal to average market price 5,709 49.07 12,084 29.37 872 32.95
Granted at price greater than average market price ——— — 1,334 31.63
Exercised (1,273) 19.51 (962) 18.93 (112) 24.80
Forfeited (2,969) 31.94 (3,668) 25.60 (800) 20.84
Outstanding at end of year 24,166 $ 31.18 22,699 $ 26.16 15,245 $ 23.03
Exercisable at end of year 3,665 $ 22.44 3,006 $ 21.16 1,251 $ 23.84
Weighted average of fair value of options granted $ 19.20 $ 11.65 $ 13.37
The following table summarizes information about stock options outstanding and exercisable at December 25, 1999 (tabular
options in thousands):
Options Outstanding Options Exercisable
Weighted
Average Weighted Weighted
Remaining Average Average
Range of Exercise Prices Options Contractual Life Exercise Price Options Exercise Price
$ 0.01–17.80 1,932 4.91 $ 15.22 1,582 $ 14.67
22.02–29.40 11,874 7.11 25.60 1,279 26.11
30.41–34.47 4,642 8.26 31.77 773 31.46
35.13–46.97 5,078 9.18 44.50 30 42.05
72.75 640 9.27 72.75 1 72.75
24,166 3,665
note 16