Pizza Hut 1999 Annual Report Download - page 29
Download and view the complete annual report
Please find page 29 of the 1999 Pizza Hut annual report below. You can navigate through the pages in the report by either clicking on the pages listed below, or by using the keyword search tool below to find specific information within the annual report.-
 1
1 -
2
-
3
-
4
-
5
-
6
-
7
-
8
-
9
-
10
-
11
-
12
-
13
-
14
-
15
-
16
-
17
-
18
-
 19
19 -
 20
20 -
 21
21 -
 22
22 -
 23
23 -
 24
24 -
 25
25 -
 26
26 -
 27
27 -
 28
28 -
 29
29 -
 30
30 -
 31
31 -
 32
32 -
 33
33 -
 34
34 -
 35
35 -
 36
36 -
 37
37 -
 38
38 -
 39
39 -
40
-
41
-
42
-
43
-
44
-
45
-
46
-
47
-
48
-
49
-
50
-
51
-
52
-
53
-
54
-
55
-
56
-
57
-
58
-
59
-
60
-
61
-
62
-
63
-
64
-
65
-
66
-
67
-
68
-
69
-
70
-
71
-
72
 |
 |

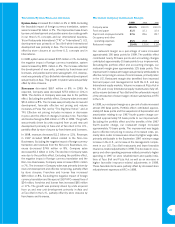
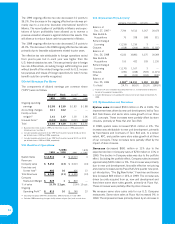
Worldwide System Sales and Revenues
System Sales increased $1.1 billion or 6% in 1999. Excluding
the favorable impact of foreign currency translation, system
sales increased $1 billion or 5%. The improvement was driven
by new unit development and positive same store sales growth
in our three U.S. concepts and our international business,
Tricon Restaurants International (“TRI” or “International”). U.S.
development was primarily at Taco Bell while International
development was primarily in Asia. The increase was partially
offset by store closures at our three U.S. concepts and in
International.
In 1998, system sales increased $155 million or 1%. Excluding
the negative impact of foreign currency translation, system
sales increased by $871 million or 4%. The increase reflected
the development of new units, primarily by franchisees and
licensees, and positive same store sales growth. U.S. develop-
ment was primarily at Taco Bell while international development
was primarily in Asia. This growth in system sales was partially
offset by store closures.
Revenues decreased $657 million or 8% in 1999. As
expected, Company sales decreased $753 million or 10% in
1999. The decline in Company sales was due to the portfolio
effect. Excluding the portfolio effect, Company sales increased
$513 million or 8%. The increase was primarily due to new unit
development, favorable effective net pricing and volume
increases at Pizza Hut, led by “The Big New Yorker,” and at
TRI. Effective net pricing includes increases or decreases
in price and the effect of changes in product mix. Franchise
and license fees grew $96 million or 15% in 1999. The growth
was primarily driven by units acquired from us and new unit
development primarily in Asia and at Taco Bell in the U.S.,
partially offset by store closures by franchisees and licensees.
In 1998, revenues decreased $1.2 billion or 12%. Revenues
in 1997 included $268 million related to the Non-core
Businesses. Excluding the negative impact of foreign currency
translation and revenues from the Non-core Businesses, rev-
enues decreased $749 million or 8%. Company sales
decreased $1.3 billion or 14%. The decline in Company sales
was due to the portfolio effect. Excluding the portfolio effect,
the negative impact of foreign currency translation and the
Non-core Businesses, Company sales increased $511 million
or 7%. The increase in Company sales was primarily driven by
new unit development and effective net pricing, partially offset
by store closures. Franchise and license fees increased
$49 million or 8%. Excluding the negative impact of foreign
currency translation and the special 1997 KFC renewal fees of
$24 million, franchise and license fees increased $95 million
or 17%. The growth was primarily driven by units acquired
from us and new unit development primarily in Asia and
at Taco Bell in the U.S., partially offset by store closures by
franchisees and licensees.
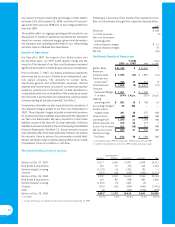
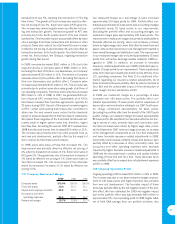
Worldwide Company Restaurant Margin
1999 1998 1997
Company sales 100.0% 100.0% 100.0%
Food and paper 31.5 32.1 32.4
Payroll and employee benefits 27.6 28.6 28.7
Occupancy and other
operating expenses 25.5 25.8 27.3
Restaurant margin 15.4% 13.5% 11.6%
Our restaurant margin as a percentage of sales increased
approximately 190 basis points for 1999. The portfolio effect
contributed nearly 50 basis points and accounting changes
contributed approximately 15 basis points to our improvement.
Excluding the portfolio effect and accounting changes, our
restaurant margin grew approximately 125 basis points. This
improvement in restaurant margin was primarily attributable to
effective net pricing in excess of cost increases, primarily labor
in the U.S. Restaurant margin also benefited from improved
food and paper cost management in both the U.S. and key
International equity markets. Volume increases at Pizza Hut in
the U.S. and in key International equity markets were fully off-
set by volume declines at Taco Bell and the unfavorable impact
of the introduction of lower margin chicken sandwiches at KFC
in the U.S.
In 1998, our restaurant margin as a percent of sales increased
almost 190 basis points. Portfolio effect contributed approxi-
mately 65 basis points and the suspension of depreciation and
amortization relating to our 1997 fourth quarter charge con-
tributed approximately 55 basis points to our improvement.
Excluding the portfolio effect and the benefits of the 1997
fourth quarter charge, our restaurant margin increased
approximately 70 basis points. The improvement was largely
due to effective net pricing in excess of increased costs, pri-
marily labor. Labor increases were driven by higher wage rates,
primarily attributable to the September 1997 minimum wage
increase in the U.S., an increase in the management comple-
ment in our U.S. Taco Bell restaurants and lower favorable
insurance-related adjustments in 1998. The decrease in occu-
pancy and other operating expenses related primarily to higher
spending in 1997 on store refurbishment and quality initia-
tives at Taco Bell and Pizza Hut as well as an increase in
higher favorable insurance-related adjustments in 1998.
These favorable items were partially offset by increased store
refurbishment expenses at KFC in 1998.
27