Pizza Hut 1999 Annual Report Download - page 35
Download and view the complete annual report
Please find page 35 of the 1999 Pizza Hut annual report below. You can navigate through the pages in the report by either clicking on the pages listed below, or by using the keyword search tool below to find specific information within the annual report.-
 1
1 -
2
-
3
-
4
-
5
-
6
-
7
-
8
-
9
-
10
-
11
-
12
-
13
-
14
-
15
-
16
-
17
-
18
-
19
-
20
-
21
-
22
-
23
-
24
-
 25
25 -
 26
26 -
 27
27 -
 28
28 -
 29
29 -
 30
30 -
 31
31 -
 32
32 -
 33
33 -
 34
34 -
 35
35 -
 36
36 -
 37
37 -
 38
38 -
 39
39 -
 40
40 -
 41
41 -
 42
42 -
 43
43 -
 44
44 -
 45
45 -
46
-
47
-
48
-
49
-
50
-
51
-
52
-
53
-
54
-
55
-
56
-
57
-
58
-
59
-
60
-
61
-
62
-
63
-
64
-
65
-
66
-
67
-
68
-
69
-
70
-
71
-
72
 |
 |

Franchise and license fees rose $27 million or 13% in 1999.
The increase in franchise and license fees was driven by new
unit development, same store sales growth and units acquired
from us. New unit development was primarily in Asia. These
increases were partially offset by store closures.
In 1998, revenues decreased $280 million or 12%. Excluding
the negative impact of foreign currency translation, revenues
decreased $86 million or 4%. Company sales decreased
$279 million or 13% driven by the portfolio effect. Excluding the
negative impact of foreign currency translation and the portfolio
effect, Company sales increased $180 million or 10%. The
increase was driven by new unit development, primarily in Asia,
and effective net pricing. Franchise and license fees decreased
$1 million or less than 1%. Excluding the negative impact of
foreign currency translation, franchise and license fees
increased $21 million or 11%. The increase was driven by new
unit development, primarily in Asia, and units acquired from us,
partially offset by store closures by franchisees and licensees.
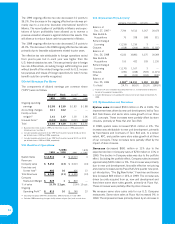
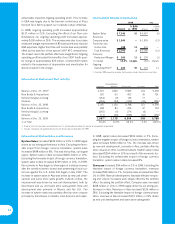
International Company Restaurant Margin
1999 1998 1997
Company sales 100.0% 100.0% 100.0%
Food and paper 36.0 35.8 36.5
Payroll and employee benefits 21.0 22.6 22.7
Occupancy and other
operating expenses 28.6 28.6 29.4
Restaurant margin 14.4% 13.0% 11.4%
Our restaurant margin as a percentage of sales increased
approximately 140 basis points in 1999. Excluding the favor-
able impact of foreign currency translation, restaurant margins
increased approximately 130 basis points. Portfolio effect con-
tributed approximately 50 basis points. Excluding the portfolio
effect, our restaurant margin grew approximately 80 basis
points. The improvement in restaurant margin was driven by
volume increases in China, Korea and Australia and favorable
effective net pricing in excess of cost increases, primarily in the
U.K., Puerto Rico and Korea. Our growth in 1999 was partially
offset by volume decreases in Taiwan and Poland. In addition
to the factors described above, margins benefited from
improved cost management, primarily in China.
In 1998, our restaurant margin increased over 160 basis
points. Excluding the negative impact of foreign currency trans-
lation, restaurant margin increased approximately 195 basis
points. The increase was driven primarily by the suspension of
depreciation and amortization relating to restaurants included
in our 1997 fourth quarter charge, which contributed 110 basis
points. The portfolio effect also contributed approximately
30 basis points to the improvement. The remaining margin
improvement of approximately 55 basis points resulted from
favorable effective net pricing in excess of costs in Mexico,
Australia and Spain. Restaurant margin improvement was par-
tially offset by volume declines in Asia, led by Korea. The
economic turmoil throughout Asia resulted in an overall volume
decline, even though we had volume increases in Mexico,
Canada and Spain.
International Ongoing Operating Profit
Ongoing operating profit grew $74 million or 39% in 1999.
Excluding the favorable impact of foreign currency translation,
ongoing operating profit increased $69 million or 36%. The
increase in operating profit was driven by our base margin
improvement of approximately 80 basis points, higher fran-
chise and license fees and a decline in G&A. Our ongoing
operating profit benefited from the economic recovery in Asia.
Operating profit in Asia increased $55 million or 84%.
Excluding the favorable impact of foreign currency translation,
Asia operating profit increased $46 million or 72%. Additionally,
ongoing operating profit included benefits of approximately
$15 million from our 1998 fourth quarter decision to streamline
our international infrastructure in Asia, Europe and Latin
America and other actions.
In 1998, ongoing operating profit increased $19 million or
11%. Excluding the negative impact of foreign currency trans-
lation, ongoing operating profit increased $43 million or 25% in
1998. The increase was driven by our base margin improve-
ment of 55 basis points and a decline in G&A. The favorable
impact of these items was partially offset by the net negative
impact of the portfolio effect, which was approximately $10 mil-
lion or approximately 6% of operating profit in 1997. Lower
franchise and license fees, net of fees from units acquired from
us, also unfavorably impacted ongoing operating profit.
Ongoing operating profit in 1998 included benefits related to
our 1997 fourth quarter charge of approximately $29 million,
of which $14 million related to the suspension of depreciation
and amortization for the stores included in the charge. These
benefits were fully offset by the 30% decline in Asia operating
profit and Year 2000 spending.
Consolidated Cash Flows
Net cash provided by operating activities decreased
$109 million to $565 million in 1999. Net income before facil-
ity actions and all other non-cash charges increased $12 million
from $780 million to $792 million, despite the net decline of
1,400 Company restaurants. This decline was primarily due to
our portfolio activities during the year. Portfolio activities also
contributed to the decline of $128 million in our operating work-
ing capital deficit due primarily to a reduction in accounts
payable and other current liabilities. Our operating working cap-
ital deficit, which excludes cash, short-term investments and
short-term borrowings, is typical of restaurant operations where
the majority of sales are for cash while payment to suppliers for
food and supply inventories carry longer payment terms, gen-
erally from 10–30 days. The decline in accounts payable was a
result of the reduction in the number of our restaurants and tim-
ing in the payment of liabilities. Other current liabilities declined
primarily due to lower vacation accruals due to the change in
vacation policy (described in Note 5), lower casualty loss
reserves based on our independent actuary’s valuation, lower
advertising accruals and lower accrued interest due to the
reduction in debt. As expected, the refranchising of our restau-
rants and the related increase in franchised units have caused
accounts receivable for franchise fees to increase. 33