Pizza Hut 1999 Annual Report Download - page 4
Download and view the complete annual report
Please find page 4 of the 1999 Pizza Hut annual report below. You can navigate through the pages in the report by either clicking on the pages listed below, or by using the keyword search tool below to find specific information within the annual report.-
 1
1 -
 2
2 -
 3
3 -
 4
4 -
 5
5 -
 6
6 -
 7
7 -
 8
8 -
 9
9 -
 10
10 -
 11
11 -
 12
12 -
 13
13 -
 14
14 -
 15
15 -
16
-
17
-
18
-
19
-
20
-
21
-
22
-
23
-
24
-
25
-
26
-
27
-
28
-
29
-
30
-
31
-
32
-
33
-
34
-
35
-
36
-
37
-
38
-
39
-
40
-
41
-
42
-
43
-
44
-
45
-
46
-
47
-
48
-
49
-
50
-
51
-
52
-
53
-
54
-
55
-
56
-
57
-
58
-
59
-
60
-
61
-
62
-
63
-
64
-
65
-
66
-
67
-
68
-
69
-
70
-
71
-
72
 |
 |

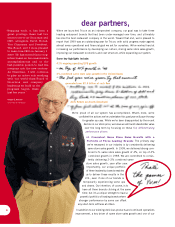
dear partners,
When we launched Tricon as an independent company, our goal was to take three
leading restaurant brands that had been under-managed over time, and ultimately
become the best restaurant company in the world. Toward that end, we’re pleased to
report that 1999 was an outstanding year for Tricon, with solid progress made against
almost every operational and financial goal we set for ourselves. We’ve worked hard at
increasing our performance by developing our culture, driving same store sales growth,
improving our restaurant economics and cost structure, while expanding our system.
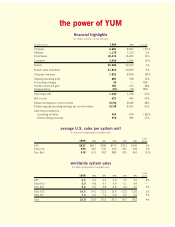
Some key highlights include:
41% ongoing operating EPS growth
4% combined same store sales growth in the United States
generated over $1.5 billion of cash flow
24% Return on Assets Employed
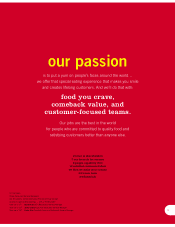
We’re proud of all our system has accomplished. What’s more, we’re
confident the actions we’ve undertaken this past year will pave the way
for greater success. While we’ve been disappointed by the recent
decline in our stock price, we know we will build shareholder value
over the long term by focusing on these five differentiating
performance drivers:
#1 Consistent Same Store Sales Growth with a
Portfolio of Three Leading Brands: The primary way
we’re measured in our industry is by consistently delivering
same store sales growth. In 1999, we delivered strong com-
bined U.S. same store sales growth of 4%, on top of 4%
combined growth in 1998. We are committed to consis-
tently delivering 2–3% combined same
store sales growth, year after year.
Importantly, our unique portfolio
of three leadership brands enables
us to deliver these results in the
U.S., even if one of our brands is
temporarily experiencing some ups
and downs. Our intention, of course, is to
have all three brands clicking at the same
time; but it’s a unique strength to have a
powerful portfolio of leading brands where
stronger performance by some can offset
any short-term softness at others.
In addition to our existing delicious products and continued operations
improvement, a key driver of same store sales growth and one of our
2
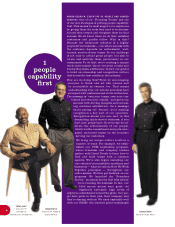
“Stepping back, it has been a
great privilege these last two
years to serve as Chairman and
CEO, alongside David Novak,
Vice Chairman and President.
The Board and I were pleased
to name him CEO on January 1,
2000. He has earned this recog-
nition based on his considerable
accomplishments and is the
best possible person to lead the
company into the new century.
As Chairman, I will continue
to play an active role working
with our world-class Board of
Directors and company
leaders as we build on the
progress begun these
last few years.”
Andrall E. Pearson
Chairman of the Board