Pizza Hut 1999 Annual Report Download - page 31
Download and view the complete annual report
Please find page 31 of the 1999 Pizza Hut annual report below. You can navigate through the pages in the report by either clicking on the pages listed below, or by using the keyword search tool below to find specific information within the annual report.
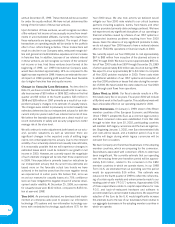
charge to dispose of certain stores which may have otherwise
been impaired in our evaluations, and improved performance
in 1998, primarily at Pizza Hut in the U.S.
Our 1999 refranchising gains, store closure costs and impair-
ment charges are not necessarily indicative of future results.
Worldwide Operating Profit
% B(W) % B(W)
1999 vs. 1998 1998 vs. 1997
U.S. ongoing
operating profit(a) $ 813 10 $ 740 23
International
ongoing
operating profit 265 39 191 11
Accounting changes 29 NM ——
Foreign exchange
net (loss) gain (3) NM 6NM
Ongoing unallocated and
corporate expenses(b) (194) (14) (169) (93)
Facility actions
net gain (loss) 381 38 275 NM
Unusual items (51) NM (15) NM
Reported operating
profit $ 1,240 21 $ 1,028 NM
(a) Excludes 1999 favorable accounting changes of approximately $15 million.
(b) Excludes 1999 favorable accounting changes of approximately $14 million.
The increases in U.S. and International ongoing operating profit
for 1999 and 1998 are discussed fully on pages 31 and 33,
respectively. Accounting changes, facility actions net gain (loss)
and unusual items are discussed in Note 5.
Ongoing unallocated and corporate expenses increased
$25 million or 14% in 1999. The increase was driven by higher
strategic and other corporate spending, system standardiza-
tion investment and the absence of favorable cost recovery
agreements from AmeriServe and PepsiCo that were termi-
nated in 1998. These increases were partially offset by the
absence of costs associated with relocating certain of our oper-
ations from Wichita, Kansas in 1998.
In 1998, ongoing unallocated and corporate expenses
increased $82 million or 93%. The increase was primarily due
to spending on Year 2000 compliance and remediation efforts,
costs to relocate our processing center from Wichita to other
facilities and expenses incurred as an independent, publicly
owned company, as well as, additional expenses related to the
efforts to improve and standardize operating, administrative
and accounting systems.
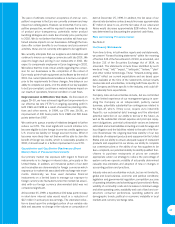
Worldwide Interest Expense, Net
1999 1998 1997
External debt $ 218 $ 291 $ 102
PepsiCo allocation —— 188
Interest expense 218 291 290
Interest income (16) (19) (14)
Interest expense, net $ 202 $ 272 $ 276
Our net interest expense decreased approximately $70 million
in 1999. The decline was primarily due to the reduction of debt
through use of after-tax cash proceeds from our refranchising
activities and cash from operations.
In 1998, our net interest expense decreased approximately
$4 million. The decline was due to an increase in interest
income, partially offset by a slight increase in interest expense.
The increase in interest income was driven by higher average
international investment balances. The slight increase in inter-
est expense was primarily due to higher average outstanding
debt balances.
Prior to the Spin-off in the fourth quarter of 1997, our opera-
tions were financed through operating cash flows, proceeds
from refranchising activities and investment by and advances
from PepsiCo. At the Spin-off date, we borrowed $4.55 billion
under a bank credit agreement to replace the financing previ-
ously provided by PepsiCo and, additionally, to fund a dividend
to PepsiCo. See Notes 2 and 11. For periods prior to the Spin-
off, our interest expense included PepsiCo’s allocation of its
interest expense (PepsiCo’s weighted average interest rate
applied to the average balance of investments by and advances
from PepsiCo) and interest on our external debt, including cap-
ital leases. We believe such allocated interest expense is not
indicative of the interest expense that we would have incurred
as an independent, publicly owned company. Subsequent to
the Spin-off date, our interest costs consist primarily of interest
expense related to our bank credit agreement, unsecured
notes and other external debt. Most of the other external debt
existed at the Spin-off date.
Worldwide Income Taxes
1999 1998 1997
Reported
Income taxes $ 411 $ 311 $ 76
Effective tax rate 39.5% 41.1% NM
Ongoing(a)
Income taxes $ 267 $ 210 $ 179
Effective tax rate 39.3% 42.3% 45.2%
(a) Excludes the effects of 1999 accounting changes, facility actions net gain (loss) and
unusual items. See Note 5 for a discussion of these exclusions.
For periods prior to the Spin-off in 1997, income tax expense
was calculated, to the extent possible, as if we filed income tax
returns separate from PepsiCo.
The following reconciles the U.S. federal statutory tax rate to
our ongoing effective tax rate:
1999 1998 1997
U.S. federal statutory tax rate 35.0% 35.0% 35.0%
State income tax,
net of federal tax benefit 2.3 2.8 3.9
Foreign and U.S. tax effects
attributable to foreign operations 1.5 6.3 4.9
Adjustments relating to prior years 0.2 (3.3) 0.8
Other, net 0.3 1.5 0.6
Ongoing effective tax rate 39.3% 42.3% 45.2% 29


