Pizza Hut 1999 Annual Report Download - page 40
Download and view the complete annual report
Please find page 40 of the 1999 Pizza Hut annual report below. You can navigate through the pages in the report by either clicking on the pages listed below, or by using the keyword search tool below to find specific information within the annual report.-
 1
1 -
2
-
3
-
4
-
5
-
6
-
7
-
8
-
9
-
10
-
11
-
12
-
13
-
14
-
15
-
16
-
17
-
18
-
19
-
20
-
21
-
22
-
23
-
24
-
25
-
26
-
27
-
28
-
29
-
 30
30 -
 31
31 -
 32
32 -
 33
33 -
 34
34 -
 35
35 -
 36
36 -
 37
37 -
 38
38 -
 39
39 -
 40
40 -
 41
41 -
 42
42 -
 43
43 -
 44
44 -
 45
45 -
 46
46 -
 47
47 -
 48
48 -
 49
49 -
 50
50 -
51
-
52
-
53
-
54
-
55
-
56
-
57
-
58
-
59
-
60
-
61
-
62
-
63
-
64
-
65
-
66
-
67
-
68
-
69
-
70
-
71
-
72
 |
 |

38
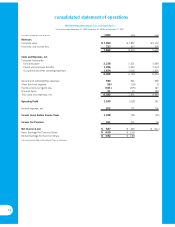
consolidated statement of operations
TRICON Global Restaurants, Inc. and Subsidiaries
Fiscal years ended December 25, 1999, December 26, 1998 and December 27, 1997
(in millions, except per share amounts) 1999 1998 1997
Revenues
Company sales $ 7,099 $ 7,852 $ 9,112
Franchise and license fees 723 627 578
7,822 8,479 9,690
Costs and Expenses, net
Company restaurants
Food and paper 2,238 2,521 2,949
Payroll and employee benefits 1,956 2,243 2,614
Occupancy and other operating expenses 1,814 2,030 2,491
6,008 6,794 8,054
General and administrative expenses 920 941 956
Other (income) expense (16) (24) 8
Facility actions net (gain) loss (381) (275) 247
Unusual items 51 15 184
Total costs and expenses, net 6,582 7,451 9,449
Operating Profit 1,240 1,028 241
Interest expense, net 202 272 276
Income (Loss) Before Income Taxes 1,038 756 (35)
Income Tax Provision 411 311 76
Net Income (Loss) $ 627 $ 445 $ (111)
Basic Earnings Per Common Share $ 4.09 $ 2.92
Diluted Earnings Per Common Share $ 3.92 $ 2.84
See accompanying Notes to Consolidated Financial Statements.