Pizza Hut 1999 Annual Report Download - page 57
Download and view the complete annual report
Please find page 57 of the 1999 Pizza Hut annual report below. You can navigate through the pages in the report by either clicking on the pages listed below, or by using the keyword search tool below to find specific information within the annual report.-
 1
1 -
2
-
3
-
4
-
5
-
6
-
7
-
8
-
9
-
10
-
11
-
12
-
13
-
14
-
15
-
16
-
17
-
18
-
19
-
20
-
21
-
22
-
23
-
24
-
25
-
26
-
27
-
28
-
29
-
30
-
31
-
32
-
33
-
34
-
35
-
36
-
37
-
38
-
39
-
40
-
41
-
42
-
43
-
44
-
45
-
46
-
 47
47 -
 48
48 -
 49
49 -
 50
50 -
 51
51 -
 52
52 -
 53
53 -
 54
54 -
 55
55 -
 56
56 -
 57
57 -
 58
58 -
 59
59 -
 60
60 -
 61
61 -
 62
62 -
 63
63 -
 64
64 -
 65
65 -
 66
66 -
 67
67 -
68
-
69
-
70
-
71
-
72
 |
 |

55
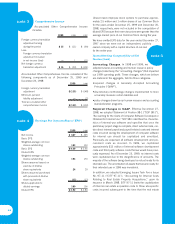
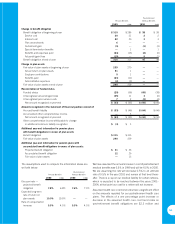
The assumptions used to compute the information above are
set forth below:
Postretirement
Pension Benefits Medical Benefits
1999 1998 1999 1998
Discount rate —
projected benefit
obligation 7.8% 6.8% 7.6% 7.0%
Expected long-term
rate of return on
plan assets 10.0% 10.0% ——
Rate of compensation
increase 5.5% 4.5% 5.5% 4.5%
We have assumed the annual increase in cost of postretirement
medical benefits was 6.5% in 1999 and will be 6.0% in 2000.
We are assuming the rate will decrease 0.5% to an ultimate
rate of 5.5% in the year 2001 and remain at that level there-
after. There is a cap on our medical liability for certain retirees,
which is expected to be reached between the years 2001–
2004; at that point our cost for a retiree will not increase.
Assumed health care cost trend rates have a significant effect
on the amounts reported for our postretirement health care
plans. The effects of a one percentage point increase or
decrease in the assumed health care cost trend rates on
post-retirement benefit obligations are $2.3 million and
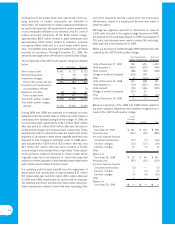
Postretirement
Pension Benefits Medical Benefits
1999 1998 1999 1998
Change in benefit obligation
Benefit obligation at beginning of year $ 315 $ 286 $38 $38
Service cost 20 21 22
Interest cost 22 20 33
Plan amendments 6———
Curtailment gain (5) —(1) (3)
Special termination benefits —1—1
Benefits and expenses paid (24) (13) (2) (2)
Actuarial (gain) loss (19) —5(1)
Benefit obligation at end of year 315 315 45 38
Change in plan assets
Fair value of plan assets at beginning of year 259 270 ——
Actual return on plan assets 51 1——
Employer contributions 51——
Benefits paid (23) (11) ——
Administrative expenses (2) (2) ——
Fair value of plan assets at end of year 290 259 ——
Reconciliation of funded status
Funded status (25) (56) (45) (38)
Unrecognized actuarial (gain) loss (35) 11 3(2)
Unrecognized prior service costs 72(2) (4)
Net amount recognized at year-end $ (53) $ (43) $ (44) $ (44)
Amounts recognized in the statement of financial position consist of:
Accrued benefit liability $ (53) $ (46) $ (44) $ (44)
Accumulated other comprehensive income —3——
Net amount recognized at year-end $ (53) $ (43) $ (44) $ (44)
Other comprehensive income attributable to change
in additional minimum liability recognition $ (3) $3
Additional year-end information for pension plans
with benefit obligations in excess of plan assets:
Benefit obligation $ 315 $ 315
Fair value of plan assets 290 259
Additional year-end information for pension plans with
accumulated benefit obligations in excess of plan assets:
Projected benefit obligation $31 $46
Accumulated benefit obligation 12 29
Fair value of plan assets —15