Pizza Hut 1999 Annual Report Download - page 34
Download and view the complete annual report
Please find page 34 of the 1999 Pizza Hut annual report below. You can navigate through the pages in the report by either clicking on the pages listed below, or by using the keyword search tool below to find specific information within the annual report.-
 1
1 -
2
-
3
-
4
-
5
-
6
-
7
-
8
-
9
-
10
-
11
-
12
-
13
-
14
-
15
-
16
-
17
-
18
-
19
-
20
-
21
-
22
-
23
-
 24
24 -
 25
25 -
 26
26 -
 27
27 -
 28
28 -
 29
29 -
 30
30 -
 31
31 -
 32
32 -
 33
33 -
 34
34 -
 35
35 -
 36
36 -
 37
37 -
 38
38 -
 39
39 -
 40
40 -
 41
41 -
 42
42 -
 43
43 -
 44
44 -
45
-
46
-
47
-
48
-
49
-
50
-
51
-
52
-
53
-
54
-
55
-
56
-
57
-
58
-
59
-
60
-
61
-
62
-
63
-
64
-
65
-
66
-
67
-
68
-
69
-
70
-
71
-
72
 |
 |

unfavorably impacted ongoing operating profit. This increase
in G&A was largely due to the biennial conferences at Pizza
Hut and Taco Bell to support our corporate culture initiatives.
In 1998, ongoing operating profit increased approximately
$137 million or 23%. Excluding the effect of our Non-core
Businesses, our ongoing operating profit increased approxi-
mately $150 million or 26%. The increase was due to our base
restaurant margin improvement of 80 basis points and reduced
G&A expenses. Higher franchise and license fees were partially
offset by the absence of the special 1997 KFC renewal fees.
The impact due to the portfolio effect was insignificant. Ongoing
operating profit included the benefits of our 1997 fourth quar-
ter charge of approximately $35 million, of which $19 million
related to the suspension of depreciation and amortization for
stores included in the charge.
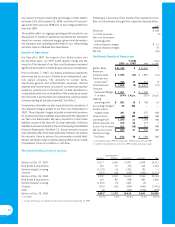
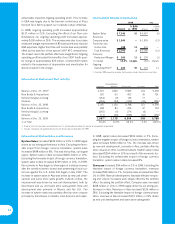
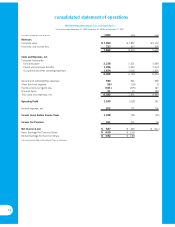
International Results of Operations
1999 1998
% B(W) % B(W)
Amount vs. 1998 Amount vs. 1997
System Sales $ 7,246 10 $ 6,607 (5)
Revenues
Company sales $ 1,846 — $ 1,839 (13)
Franchise and
license fees 228 13 201 —
Total Revenues $ 2,074 2 $ 2,040 (12)
Company
Restaurant Margin $ 266 11 $ 239 (1)
% of sales 14.4% 1.4 ppts)
.13.0% 1.6 ppts)
.
Ongoing
Operating Profit(1) $ 265 39 $ 191 11
(1) Excludes 1999 accounting changes, facility actions net gain (loss) and unusual items.
32
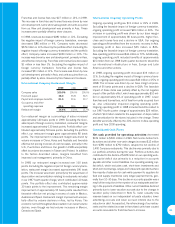
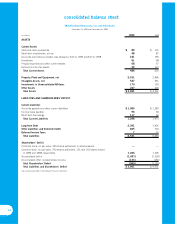
International Restaurant Unit Activity
Unconsolidated
Company Affiliates Franchisees Licensees Total
Balance at Dec. 27, 1997(a) 2,323 1,090 5,585 241 9,239
New Builds & Acquisitions 150 63 452 36 701
Refranchising & Licensing (154) (9) 86 77 —
Closures (154) (24) (335) (33) (546)
Balance at Dec. 26, 1998 2,165 1,120 5,788 321 9,394
New Builds & Acquisitions 168 83 426 47 724
Refranchising & Licensing (265) (5) 276 (6) —
Closures (71) (20) (186) (53) (330)
Balance at Dec. 25, 1999 1,997(b) 1,178 6,304 309 9,788
% of Total 20.4% 12.0% 64.4% 3.2% 100.0%
(a) A total of 114 units have been reclassified from the U.S. to International to reflect the transfer of management responsibility.
(b) Includes 1 Company unit approved for closure, but not yet closed at December 25, 1999.
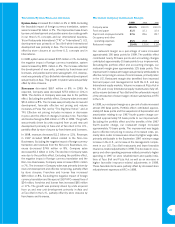
International System Sales and Revenues
System Sales increased $639 million or 10% in 1999 largely
driven by our strong performance in Asia. Excluding the favor-
able impact from foreign currency translation, system sales
increased $498 million or 8%. This was led by Asia, our largest
region. System sales in Asia increased $426 million or 19%.
Excluding the favorable impact of foreign currency translation,
system sales in Asia increased $229 million or 10%. In 1999,
the economy in Asia began to show signs of a steady recovery
after the overall economic turmoil and weakening of local cur-
rencies against the U.S. dollar that began in late 1997. The
increase in system sales in Asia was driven by new unit devel-
opment and same store sales growth. Outside of Asia, the
improvement was driven by new unit development, both by
franchisees and us, and same store sales growth. New unit
development was primarily in Mexico and the U.K. The
increase in system sales was partially offset by store closures
primarily by franchisees in Canada, Latin America and Japan.
In 1998, system sales decreased $356 million or 5%. Exclu-
ding the negative impact of foreign currency translation, system
sales increased $360 million or 5%. The increase was driven
by new unit development, primarily in Asia, partially offset by
store closures in other countries/markets. System sales in Asia
decreased $254 million or 10% as a result of the economic tur-
moil. Excluding the unfavorable impact of foreign currency
translation, system sales in Asia increased 8%.
Revenues increased $34 million or 2% in 1999. Excluding the
favorable impact of foreign currency translation, revenues
increased $29 million or 1%. Company sales increased less than
1% in 1999. New unit development, favorable effective net pric-
ing and volume increases were largely offset by the portfolio
effect. Excluding the portfolio effect, Company sales increased
$208 million or 13% in 1999 largely driven by our strong per-
formance in Asia. Revenues in Asia increased $139 million or
28%. Excluding the favorable impact of foreign currency trans-
lation, revenues in Asia increased $115 million or 23% driven
by new unit development and same store sales growth.