Pizza Hut 1999 Annual Report Download - page 41
Download and view the complete annual report
Please find page 41 of the 1999 Pizza Hut annual report below. You can navigate through the pages in the report by either clicking on the pages listed below, or by using the keyword search tool below to find specific information within the annual report.-
 1
1 -
2
-
3
-
4
-
5
-
6
-
7
-
8
-
9
-
10
-
11
-
12
-
13
-
14
-
15
-
16
-
17
-
18
-
19
-
20
-
21
-
22
-
23
-
24
-
25
-
26
-
27
-
28
-
29
-
30
-
 31
31 -
 32
32 -
 33
33 -
 34
34 -
 35
35 -
 36
36 -
 37
37 -
 38
38 -
 39
39 -
 40
40 -
 41
41 -
 42
42 -
 43
43 -
 44
44 -
 45
45 -
 46
46 -
 47
47 -
 48
48 -
 49
49 -
 50
50 -
 51
51 -
52
-
53
-
54
-
55
-
56
-
57
-
58
-
59
-
60
-
61
-
62
-
63
-
64
-
65
-
66
-
67
-
68
-
69
-
70
-
71
-
72
 |
 |

39
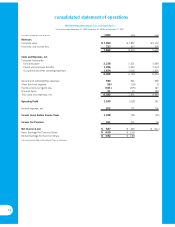
consolidated statement of cash flows
TRICON Global Restaurants, Inc. and Subsidiaries
Fiscal years ended December 25, 1999, December 26, 1998 and December 27, 1997
(in millions) 1999 1998 1997
Cash Flows — Operating Activities
Net income (loss) $ 627 $ 445 $ (111)
Adjustments to reconcile net income (loss) to
net cash provided by operating activities:
Depreciation and amortization 386 417 536
Facility actions net (gain) loss (381) (275) 247
Unusual items 45 15 184
Other liabilities and deferred credits 65 58 —
Deferred income taxes (16) 3 (138)
Other non-cash charges and credits, net 66 117 65
Changes in operating working capital,
excluding effects of acquisitions and dispositions:
Accounts and notes receivable (28) (8) (22)
Inventories 643
Prepaid expenses and other current assets (13) (20) —
Accounts payable and other current liabilities (215) 10 3
Income taxes payable 23 (92) 43
Net change in operating working capital (227) (106) 27
Net Cash Provided by Operating Activities 565 674 810
Cash Flows — Investing Activities
Capital spending (470) (460) (541)
Refranchising of restaurants 916 784 770
Acquisition of restaurants (6) ——
Sales of Non-core Businesses —— 186
Sales of property, plant and equipment 51 58 40
Other, net 31 (80) 11
Net Cash Provided by Investing Activities 522 302 466
Cash Flows — Financing Activities
Proceeds from Notes —604 —
Revolving Credit Facility activity, by original maturity
More than three months — proceeds —400 500
More than three months — payments —(900) —
Three months or less, net (860) (120) 1,935
Proceeds from long-term debt 44 2,000
Payments of long-term debt (180) (1,068) (65)
Short-term borrowings — three months or less, net 21 (53) 83
Decrease in investments by and advances from PepsiCo —— (3,281)
Dividend to PepsiCo —— (2,369)
Repurchase shares of common stock (134) ——
Other, net 30 13 59
Net Cash Used for Financing Activities (1,119) (1,120) (1,138)
Effect of Exchange Rate Changes on Cash and Cash Equivalents —(3) (7)
Net (Decrease) Increase in Cash and Cash Equivalents (32) (147) 131
Cash and Cash Equivalents — Beginning of Year 121 268 137
Cash and Cash Equivalents — End of Year $89 $ 121 $ 268
Supplemental Cash Flow Information
Interest paid $ 212 $ 303 $ 64
Income taxes paid 340 310 210
See accompanying Notes to Consolidated Financial Statements.