Pizza Hut 1999 Annual Report Download - page 30
Download and view the complete annual report
Please find page 30 of the 1999 Pizza Hut annual report below. You can navigate through the pages in the report by either clicking on the pages listed below, or by using the keyword search tool below to find specific information within the annual report.-
 1
1 -
2
-
3
-
4
-
5
-
6
-
7
-
8
-
9
-
10
-
11
-
12
-
13
-
14
-
15
-
16
-
17
-
18
-
19
-
 20
20 -
 21
21 -
 22
22 -
 23
23 -
 24
24 -
 25
25 -
 26
26 -
 27
27 -
 28
28 -
 29
29 -
 30
30 -
 31
31 -
 32
32 -
 33
33 -
 34
34 -
 35
35 -
 36
36 -
 37
37 -
 38
38 -
 39
39 -
 40
40 -
41
-
42
-
43
-
44
-
45
-
46
-
47
-
48
-
49
-
50
-
51
-
52
-
53
-
54
-
55
-
56
-
57
-
58
-
59
-
60
-
61
-
62
-
63
-
64
-
65
-
66
-
67
-
68
-
69
-
70
-
71
-
72
 |
 |

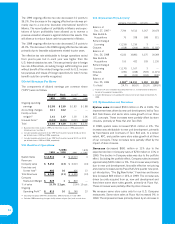
Worldwide General & Administrative Expenses
(“G&A”)
G&A decreased $21 million or 2% in 1999. Excluding the
$18 million favorable impact of 1999 accounting changes,
G&A decreased $3 million in 1999. In 1999, the favorable
impacts of our portfolio effect, our fourth quarter 1998 deci-
sion to streamline our international business and the absence
of costs associated with relocating certain operations from
Wichita, Kansas in 1998 were partially offset by higher strate-
gic and other corporate expenses. In addition to the items
described above, higher spending on biennial meetings to
support our culture initiatives and the absence of favorable
cost recovery agreements with AmeriServe Food Distribution,
Inc. (“AmeriServe”) and PepsiCo that were terminated in 1998
resulted in a modest increase in G&A in 1999. Our 1999 G&A
included Year 2000 spending of approximately $30 million as
compared to $31 million in 1998.
In 1998, G&A decreased $15 million or 2%. G&A in 1997
included approximately $24 million related to Non-core
Businesses. Excluding the impact of the Non-core Businesses,
G&A increased $9 million or 1%. The increase reflected higher
investment spending offset by the favorable impacts of our
portfolio effect, decreased restaurant support center and field
operating overhead and foreign currency translation. Our
investment spending consisted primarily of costs related to
Year 2000 compliance and remediation efforts of $31 million in
1998 versus $4 million in 1997, along with the costs to relo-
cate our processing center from Wichita to other existing
restaurant support centers of $14 million. In addition, we expe-
rienced increased administrative expenses as an independent,
publicly owned company and incurred additional expenses
related to continuing efforts to improve and standardize admin-
istrative and accounting systems.
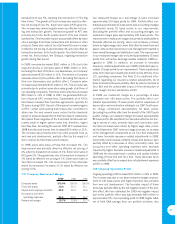
Worldwide Other (Income) Expense
% B(W) % B(W)
1999 vs. 1998 1998 vs. 1997
Equity income from
investments in
unconsolidated
affiliates $ (19) 6 $ (18) NM
Foreign exchange
net loss (gain) 3NM (6) NM
$ (16) (31) $ (24) NM
Other income declined $8 million in 1999. Net foreign
exchange losses were $3 million in 1999 compared to net
foreign exchange gains of $6 million in 1998. This decline was
due to foreign losses in 1999 versus gains in 1998 related to
U.S. dollar denominated short-term investments in Canada.
In 1998, equity income from investments in our unconsoli-
dated affiliates increased $10 million. This increase was due
primarily to lower amortization relating to the impact of the
$79 million joint venture investment impairment included in
our 1997 fourth quarter charge and, to a lesser extent, the
impact of new unit development primarily by our affiliate in the
United Kingdom. Net foreign exchange gains were $6 million
in 1998 compared to net foreign exchange losses of $16 mil-
lion in 1997. This improvement was due primarily to
non-recurring 1997 foreign exchange losses, predominantly
in Thailand and the Netherlands, and to foreign exchange
gains in 1998 primarily due to U.S. dollar denominated short-
term investments in Canada.
28
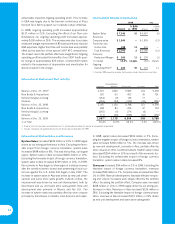
Worldwide Facility Actions Net (Gain) Loss
1999 1998 1997
Excluding Excluding
1997 4th Qtr. 1997 4th Qtr. Excluding
Charge Charge 4th Qtr.
Total Adjustments Total Adjustments Total Charge
Refranchising net gains $ (422) $ (418) $ (279) $ (281) $ (112) $ (248)
Store closure net costs 13 22 (27) 29 248 35
Impairment charges for stores that
will continue to be used in the business 16 16 25 25 111 50
Impairment charges for stores
to be closed in the future 12 12 66——
Facility actions net (gain) loss $ (381) $ (368) $ (275) $ (221) $ 247 $ (163)
Refranchising net gains resulted from the refranchising of
1,435 units in 1999, 1,373 units in 1998 and 1,407 units in
1997. These gains included initial franchise fees of $45 million,
$44 million and $41 million in 1999, 1998 and 1997, respec-
tively. See pages 25 – 26 for more details regarding our
refranchising activities.
Impairment charges for stores that will continue to be used in
the business were $16 million in 1999 compared to $25 mil-
lion in 1998 reflecting fewer underperforming stores. In 1998,
upon adoption of the SEC’s interpretation of SFAS 121, we also
began to perform impairment evaluations when we expect to
actually close a store beyond the quarter in which our closure
decision is made. This change resulted in additional impair-
ment charges of $12 million in 1999 and $6 million in 1998.
Under our prior accounting policy, these impairment charges
would have been included in store closure costs. We believe
the overall decrease in impairment in 1998 was significantly
impacted by 1997 decisions included in our fourth quarter