Pizza Hut 1999 Annual Report Download - page 28
Download and view the complete annual report
Please find page 28 of the 1999 Pizza Hut annual report below. You can navigate through the pages in the report by either clicking on the pages listed below, or by using the keyword search tool below to find specific information within the annual report.-
 1
1 -
2
-
3
-
4
-
5
-
6
-
7
-
8
-
9
-
10
-
11
-
12
-
13
-
14
-
15
-
16
-
17
-
 18
18 -
 19
19 -
 20
20 -
 21
21 -
 22
22 -
 23
23 -
 24
24 -
 25
25 -
 26
26 -
 27
27 -
 28
28 -
 29
29 -
 30
30 -
 31
31 -
 32
32 -
 33
33 -
 34
34 -
 35
35 -
 36
36 -
 37
37 -
 38
38 -
39
-
40
-
41
-
42
-
43
-
44
-
45
-
46
-
47
-
48
-
49
-
50
-
51
-
52
-
53
-
54
-
55
-
56
-
57
-
58
-
59
-
60
-
61
-
62
-
63
-
64
-
65
-
66
-
67
-
68
-
69
-
70
-
71
-
72
 |
 |

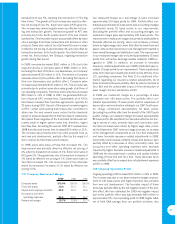
Our overall Company ownership percentage of total system
units was 23% at December 25, 1999, a decline of 5 percent-
age points from year-end 1998 and 11 percentage points from
year-end 1997.
The portfolio effect on ongoing operating profit included in our
discussions of results of operations represents the estimated
impact on revenue, restaurant margin, general and administra-
tive expenses and operating profit related to our refranchising
and store closure initiatives described above.
Results of Operations
Our Spin-off in 1997, the impacts of our facility actions over
the last three years, our 1997 fourth quarter charge and the
impacts of the disposal of our Non-core Businesses represent
significant items which complicate year-over-year comparisons.
Prior to October 7, 1997, our historical financial statements
were impacted by our lack of history as an independent, pub-
licly owned company. The amounts for certain items,
specifically general and administrative expenses, interest
expense and income taxes, included in our historical reported
results for periods prior to the Spin-off, include allocations or
computations which are not indicative of the amounts we would
have incurred if we had been an independent, publicly owned
company during all periods presented. See Note 2.
Comparative information is also impacted by the operations of
and disposal charges related to our Non-core Businesses in
1997. These disposal charges included an estimated provision
for all expected future liabilities associated with the disposal of
our Non-core Businesses. We were required to retain these
liabilities as part of the Spin-off. Our best estimates of all such
liabilities have been included in the accompanying Consolidated
Financial Statements. See Note 21. Actual amounts incurred
may ultimately differ from these estimates. However, we believe
the amounts, if any, in excess of our previously recorded liabil-
ities are not likely to have a material adverse effect on our results
of operations, financial condition or cash flow.
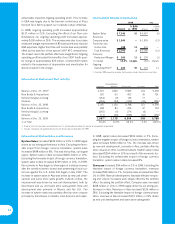
Following is a summary of the results of the operations of our
Non-core Businesses through their respective disposal dates:
1997
Revenues $ 268
% of total revenues 3%
Non-core Businesses
operating profit,
before disposal charges $13
Unusual disposal charges 54
Net loss (26)
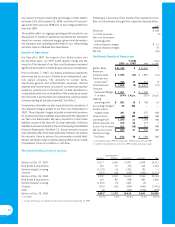
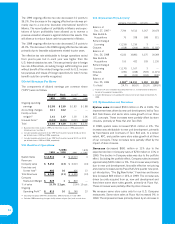
Worldwide Results of Operations
% B(W) % B(W)
1999 vs. 1998 1998 vs. 1997
System Sales $ 21,762 6 $ 20,620 1
Revenues
Company sales $ 7,099 (10) $ 7,852 (14)
Franchise and
license fees(1) 723 15 627 8
Total Revenues $ 7,822 (8) $ 8,479 (12)
Company
Restaurant Margin $ 1,091 3 $ 1,058 —
% of sales 15.4% 1.9 ppts)
.13.5% 1.9 ppts)
.
Ongoing
operating profit $ 881 15 $ 768 14
Accounting changes(2) 29 NM ——
Facility actions
net gain (loss) 381 38 275 NM
Unusual items (51) NM (15) NM
Operating Profit 1,240 21 1,028 NM
Interest expense, net 202 26 272 1
Income Tax Provision 411 (32) 311 NM
Net Income (Loss) $ 627 41 $ 445 NM
Diluted Earnings
Per Share $ 3.92 38 $ 2.84 NM
(1) Excluding the special 1997 KFC renewal fees, 1998 increased 13% over 1997.
(2) See Note 5 for complete discussion of our 1999 favorable accounting changes.
26
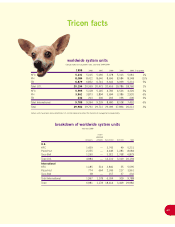
Worldwide Restaurant Unit Activity
Unconsolidated
Company Affiliates Franchisees Licensees Total
Balance at Dec. 27, 1997 10,117 1,090 15,097 3,408 29,712
New Builds & Acquisitions 225 63 790 544 1,622
Refranchising & Licensing (1,373) (9) 1,302 80 —
Closures (572) (24) (539) (436) (1,571)
Balance at Dec. 26, 1998 8,397 1,120 16,650 3,596 29,763
New Builds & Acquisitions 323 83 858 586 1,850
Refranchising & Licensing (1,435) (5) 1,443 (3) —
Closures (301) (20) (434) (646) (1,401)
Other (3) — (103) (124) (230)
Balance at Dec. 25, 1999 6,981(a) 1,178 18,414 3,409 29,982
% of total 23.3% 3.9% 61.4% 11.4% 100.0%
(a) Includes 37 Company units approved for closure but not yet closed at December 25, 1999.