Pizza Hut 1999 Annual Report Download - page 61
Download and view the complete annual report
Please find page 61 of the 1999 Pizza Hut annual report below. You can navigate through the pages in the report by either clicking on the pages listed below, or by using the keyword search tool below to find specific information within the annual report.-
 1
1 -
2
-
3
-
4
-
5
-
6
-
7
-
8
-
9
-
10
-
11
-
12
-
13
-
14
-
15
-
16
-
17
-
18
-
19
-
20
-
21
-
22
-
23
-
24
-
25
-
26
-
27
-
28
-
29
-
30
-
31
-
32
-
33
-
34
-
35
-
36
-
37
-
38
-
39
-
40
-
41
-
42
-
43
-
44
-
45
-
46
-
47
-
48
-
49
-
50
-
 51
51 -
 52
52 -
 53
53 -
 54
54 -
 55
55 -
 56
56 -
 57
57 -
 58
58 -
 59
59 -
 60
60 -
 61
61 -
 62
62 -
 63
63 -
 64
64 -
 65
65 -
 66
66 -
 67
67 -
 68
68 -
 69
69 -
 70
70 -
 71
71 -
72
 |
 |

59
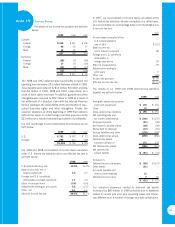
Income Taxes
The details of our income tax provision are set forth
below:
1999 1998 1997
Current:
Federal $ 342 $ 231 $ 106
Foreign 46 55 77
State 39 22 31
427 308 214
Deferred:
Federal (18) (2) (66)
Foreign 17 10 (59)
State (15) (5) (13)
(16) 3 (138)
$ 411 $ 311 $ 76
The 1998 and 1997 deferred state tax benefits included net
operating loss carryovers of $1 million that were utilized in 1999.
Taxes payable were reduced by $14 million, $3 million and less
than $1 million in 1999, 1998 and 1997, respectively, as a
result of stock option exercises. In addition, goodwill and other
intangibles were reduced by $22 million in 1999 as a result of
the settlement of a disputed claim with the Internal Revenue
Service relating to the deductibility of the amortization of reac-
quired franchise rights and other intangibles. Finally, the
valuation allowance as of the beginning of 1999 that related to
deferred tax assets in certain foreign countries was reduced by
$13 million as a result of establishing a pattern of profitability.
Our U.S. and foreign income (loss) before income taxes are set
forth below:
1999 1998 1997
U.S. $ 782 $ 542 $ 13
Foreign 256 214 (48)
$1,038 $ 756 $ (35)
Our 1999 and 1998 reconciliation of income taxes calculated
at the U.S. federal tax statutory rate to our effective tax rate is
set forth below:
1999 1998
U.S. federal statutory rate 35.0% 35.0%
State income tax, net of
federal tax benefit 3.0 2.7
Foreign and U.S. tax effects
attributable to foreign operations 1.7 4.4
Effect of unusual items (0.5) (0.6)
Adjustments relating to prior years 0.2 (2.1)
Other, net 0.1 1.6
Effective income tax rate 39.5% 41.1%
In 1997, our reconciliation of income taxes calculated at the
U.S. federal tax statutory rate was computed on a dollar basis,
as a reconciliation on a percentage basis is not meaningful due
to our pre-tax loss.
1997
Income taxes computed at the
U.S. federal statutory
rate of 35% $ (12)
State income tax,
net of federal tax benefit 18
Foreign and U.S. tax effects
attributable to
foreign operations 24
Effect of unusual items 79
Adjustments relating to
prior years 3
Other, net (36)
Income tax provision $ 76
Effective income tax rate (217.1%)
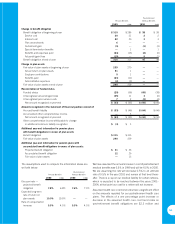
The details of our 1999 and 1998 deferred tax liabilities
(assets) are set forth below:
1999 1998
Intangible assets and property,
plant and equipment $ 170 $ 243
Other 25 8
Gross deferred tax liabilities $ 195 $ 251
Net operating loss and
tax credit carryforwards $ (140) $ (107)
Employee benefits (91) (58)
Self-insured casualty claims (38) (46)
Stores held for disposal (12) (62)
Various liabilities and other (178) (183)
Gross deferred tax assets (459) (456)
Deferred tax assets
valuation allowance 173 133
Net deferred tax assets (286) (323)
Net deferred tax
(asset) liability $ (91) $ (72)
Included in:
Deferred income tax assets $ (59) $ (137)
Other assets (51) —
Accounts payable and
other current liabilities 12 —
Deferred income taxes 765
$ (91) $ (72)
Our valuation allowance related to deferred tax assets
increased by $40 million in 1999 primarily due to additions
related to current and prior year operating losses and tempo-
rary differences in a number of foreign and state jurisdictions.
note 19