Pizza Hut 1999 Annual Report Download - page 62
Download and view the complete annual report
Please find page 62 of the 1999 Pizza Hut annual report below. You can navigate through the pages in the report by either clicking on the pages listed below, or by using the keyword search tool below to find specific information within the annual report.-
 1
1 -
2
-
3
-
4
-
5
-
6
-
7
-
8
-
9
-
10
-
11
-
12
-
13
-
14
-
15
-
16
-
17
-
18
-
19
-
20
-
21
-
22
-
23
-
24
-
25
-
26
-
27
-
28
-
29
-
30
-
31
-
32
-
33
-
34
-
35
-
36
-
37
-
38
-
39
-
40
-
41
-
42
-
43
-
44
-
45
-
46
-
47
-
48
-
49
-
50
-
51
-
 52
52 -
 53
53 -
 54
54 -
 55
55 -
 56
56 -
 57
57 -
 58
58 -
 59
59 -
 60
60 -
 61
61 -
 62
62 -
 63
63 -
 64
64 -
 65
65 -
 66
66 -
 67
67 -
 68
68 -
 69
69 -
 70
70 -
 71
71 -
 72
72
 |
 |

60
A determination of the unrecognized deferred tax liability for
temporary differences related to our investments in foreign sub-
sidiaries and investments in foreign unconsolidated affiliates
that are essentially permanent in duration is not practicable.
We have available net operating loss and tax credit carryforwards
totaling $837 million at year-end 1999 to reduce future tax of
TRICON and certain subsidiaries. The carryforwards are related
to a number of foreign and state jurisdictions. Of these carryfor-
wards, $51 million expire in 2000 and $725 million expire
at various times between 2001 and 2019. The remain-
ing $61 million of carryforwards do not expire.
Reportable Operating Segments
We are engaged principally in developing, operat-
ing, franchising or licensing the worldwide KFC, Pizza
Hut and Taco Bell concepts. We also previously operated
the Non-core Businesses, all of which were sold in 1997 prior
to the Spin-off.
KFC, Pizza Hut and Taco Bell operate throughout the U.S. and
84, 87 and 14 countries and territories outside the U.S.,
respectively. Principal international markets include Australia,
Canada, China, Japan and the U.K. At year-end 1999, we had
10 investments in unconsolidated affiliates outside the U.S.
which operate KFC and/or Pizza Hut restaurants, the most sig-
nificant of which are operating in Japan and the U.K.
As disclosed in Note 2, we identify our operating segments
based on management responsibility within the U.S. and
International. For purposes of applying SFAS 131, we consider
our three U.S. Core Business operating segments to be similar
and therefore have aggregated them into a single reportable
operating segment. Other than the U.S., no individual country
represented 10% or more of our total revenues, profits or assets.
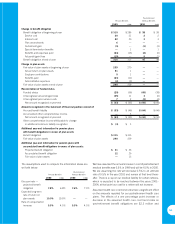
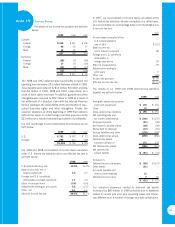
Revenues
1999 1998 1997
United States $ 5,748 $ 6,439 $ 7,370(a)
International 2,074 2,040 2,320
$ 7,822 $ 8,479 $ 9,690
Operating Profit; Interest Expense, Net;
and Income Before Income Taxes
1999 1998 1997
United States $ 828 $ 740 $ 603(a)
International(b) 265 191 172
Foreign exchange gain (loss) (3) 6 (16)
Unallocated and corporate
expenses (180) (169) (87)(c)
Facility actions net gain (loss)(d) 381 275 (247)
Unusual items(d) (51) (15) (184)
Total Operating Profit 1,240 1,028 241
Interest expense, net 202 272 276)
(c)
Income (loss) before
income taxes $ 1,038 $ 756 $ (35)
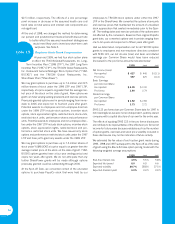
Depreciation and Amortization
1999 1998 1997
United States $ 266 $ 300 $ 388
International 110 104 143
Corporate 10 13 5
$ 386 $ 417 $ 536
Capital Spending
1999 1998 1997
United States $ 315 $ 305 $ 381
International 139 150 157
Corporate 16 53
$ 470 $ 460 $ 541
Identifiable Assets
1999 1998
United States $ 2,478 $ 2,942
International(e) 1,367 1,447
Corporate(f) 116 142
$ 3,961 $ 4,531
Long-Lived Assets
1999 1998
United States(g) $ 2,143 $ 2,616
International(g) 874 895
Corporate(g) 41 36
$ 3,058 $ 3,547
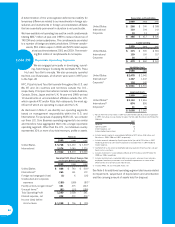
(a) Results from the United States in 1997 included the Non-core Businesses disposed of
in 1997. Excluding unusual disposal charges, the Non-core Businesses contributed the
following:
1997
Revenues $ 268
Operating profit 13
Interest expense, net 3
Income before income taxes 10
(b) Includes equity income of unconsolidated affiliates of $22 million, $18 million and
$8 million in 1999, 1998 and 1997, respectively.
(c) Includes amounts allocated by PepsiCo prior to the Spin-off of $37 million in 1997
related to general and administrative expenses and $188 million in 1997 related to
interest expense.
(d) See Note 5 for a discussion by reportable operating segment of facility actions net gain
(loss) and unusual items.
(e) Includes investment in unconsolidated affiliates of $170 million and $159 million for
1999 and 1998, respectively.
(f) Includes restricted cash, capitalized debt issuance costs, advances to our voluntary
employees’ beneficiary association trust, leasehold improvements in certain of our
office facilities and non-core assets held for sale.
(g) Includes PP&E, net and Intangible Assets, net.
See Note 5 for additional operating segment disclosures related
to impairment, suspension of depreciation and amortization
and the carrying amount of assets held for disposal.
note 20