Pizza Hut 1999 Annual Report Download - page 24
Download and view the complete annual report
Please find page 24 of the 1999 Pizza Hut annual report below. You can navigate through the pages in the report by either clicking on the pages listed below, or by using the keyword search tool below to find specific information within the annual report.-
 1
1 -
2
-
3
-
4
-
5
-
6
-
7
-
8
-
9
-
10
-
11
-
12
-
13
-
 14
14 -
 15
15 -
 16
16 -
 17
17 -
 18
18 -
 19
19 -
 20
20 -
 21
21 -
 22
22 -
 23
23 -
 24
24 -
 25
25 -
 26
26 -
 27
27 -
 28
28 -
 29
29 -
 30
30 -
 31
31 -
 32
32 -
 33
33 -
 34
34 -
35
-
36
-
37
-
38
-
39
-
40
-
41
-
42
-
43
-
44
-
45
-
46
-
47
-
48
-
49
-
50
-
51
-
52
-
53
-
54
-
55
-
56
-
57
-
58
-
59
-
60
-
61
-
62
-
63
-
64
-
65
-
66
-
67
-
68
-
69
-
70
-
71
-
72
 |
 |

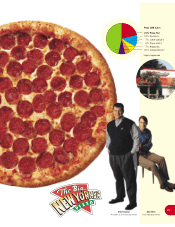
U.S. Sales by Daypart
(% of Sales)
Sales across our brands are driven
by dinner and lunch.
Marketing innovations like new dayparts
can help grow sales.
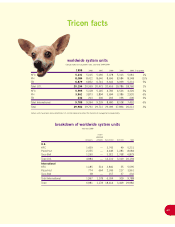
Tricon facts
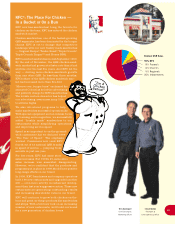
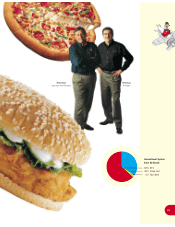
U.S. Sales by Distribution Channel
(% of Sales)
Most of our sales come
from off-premises dining,
which reflects customers’ desire
for convenient food.
Sources of System Sales
in International Restaurants
Worldwide Units
(In thousands, year-end 1999)
LUNCH
24%
DINNER
74%
SNACKS
BREAKFAST
2%
LUNCH
34%
DINNER
64%
SNACKS
BREAKFAST
2%
LUNCH
50%
DINNER
46%
SNACKS
BREAKFAST
4%
DINE IN
37%
DINE OUT
63%
ASIA
PACIFIC
43%
GREATER
CHINA
11 %
AMERICAS
21%
EUROPE
S. AFRICA
25%
DINE IN
29%
DINE OUT
71%
DINE IN
40%
DINE OUT
60%
30
27
14
11
766
Tricon
McDonald’s
Subway
Burger King
Wendy’s
Dairy Queen
Domino’s Pizza
22