Pizza Hut 1999 Annual Report Download - page 25
Download and view the complete annual report
Please find page 25 of the 1999 Pizza Hut annual report below. You can navigate through the pages in the report by either clicking on the pages listed below, or by using the keyword search tool below to find specific information within the annual report.
2323
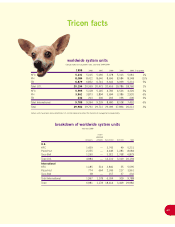
Tricon facts
worldwide system units
Compounded annual growth rates, year-end 1994-1999
1999 1998 1997 1996 1995 1994 5-yr growth
KFC 5,231 5,105 5,092 5,078 5,103 5,081 1%
PH 8,084 8,412 8,640 8,696 8,584 8,348 (1)%
TB 6,879 6,852 6,741 6,642 6,099 5,331 5%
Total U.S. 20,194 20,369 20,473 20,416 19,786 18,760 1%
KFC 5,595 5,318 5,145 4,783 4,526 4,326 5%
PH 3,961 3,873 3,894 3,694 3,386 2,920 6%
TB 232 203 200 203 196 206 2%
Total International 9,788 9,394 9,239 8,680 8,108 7,452 6%
Total 29,982 29,763 29,712 29,096 27,894 26,212 3%
Certain units have been reclassified from U.S. to International to reflect the transfer of management responsibility.
breakdown of worldwide system units
Year-end 1999
uncon-
solidated
company affiliates franchised licensed total
U.S.
KFC 1,439 — 3,743 49 5,231
Pizza Hut 2,355 — 4,446 1,283 8,084
Taco Bell 1,190 — 3,921 1,768 6,879
Total U.S. 4,984 — 12,110 3,100 20,194
International
KFC 1,185 514 3,841 55 5,595
Pizza Hut 774 664 2,306 217 3,961
Taco Bell 38 — 157 37 232
Total International 1,997 1,178 6,304 309 9,788
Total 6,981 1,178 18,414 3,409 29,982


