Pizza Hut 1999 Annual Report Download - page 27
Download and view the complete annual report
Please find page 27 of the 1999 Pizza Hut annual report below. You can navigate through the pages in the report by either clicking on the pages listed below, or by using the keyword search tool below to find specific information within the annual report.-
 1
1 -
2
-
3
-
4
-
5
-
6
-
7
-
8
-
9
-
10
-
11
-
12
-
13
-
14
-
15
-
16
-
 17
17 -
 18
18 -
 19
19 -
 20
20 -
 21
21 -
 22
22 -
 23
23 -
 24
24 -
 25
25 -
 26
26 -
 27
27 -
 28
28 -
 29
29 -
 30
30 -
 31
31 -
 32
32 -
 33
33 -
 34
34 -
 35
35 -
 36
36 -
 37
37 -
38
-
39
-
40
-
41
-
42
-
43
-
44
-
45
-
46
-
47
-
48
-
49
-
50
-
51
-
52
-
53
-
54
-
55
-
56
-
57
-
58
-
59
-
60
-
61
-
62
-
63
-
64
-
65
-
66
-
67
-
68
-
69
-
70
-
71
-
72
 |
 |

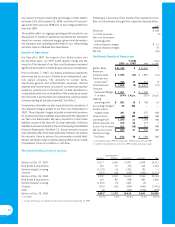
During 1999 and 1998, we continued to re-evaluate our prior
estimates of the fair market value of units to be refranchised
or closed and other liabilities arising from the charge. In 1999,
we made favorable adjustments of $13 million ($10 million
after-tax) and $11 million ($10 million after-tax) included in
facility actions net gain and unusual items, respectively. These
adjustments relate to lower-than-expected losses from stores
disposed of, decisions to retain stores originally expected to
be disposed of and changes in estimated costs. In 1998,
favorable adjustments of $54 million ($33 million after-tax)
and $11 million ($7 million after-tax) were included in facility
actions net gain and unusual items, respectively. These
adjustments primarily related to decisions to retain certain
stores originally expected to be disposed of, lower-than-
expected losses from stores disposed of and favorable lease
settlements with certain lessors related to stores closed. At
December 25, 1999, we had completed the actions covered
by the charge. See Note 5 for a detailed analysis of the 1997
fourth quarter charge, which includes a roll-forward of the
asset valuation allowances and liabilities.
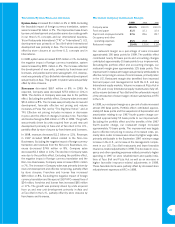
Our ongoing operating profit includes benefits from the sus-
pension of depreciation and amortization of approximately
$12 million ($7 million after-tax) and $33 million ($21 million
after-tax) in 1999 and 1998, respectively, for stores held for dis-
posal. The relatively short-term benefits from depreciation and
amortization suspension related to stores that were operating at
the end of the respective periods ceased when the stores were
refranchised, closed or a subsequent decision was made to
retain the stores.
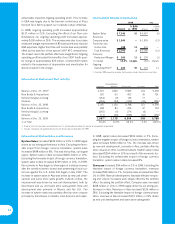
Unusual Items. We had unusual items of $51 million
($29 million after-tax), $15 million ($3 million after-tax) and
$184 million ($165 million after-tax) in 1999, 1998 and 1997,
respectively. See Note 5 for a detailed discussion of our
unusual items.
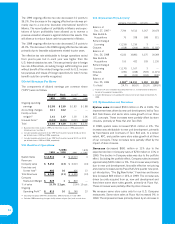
Store Portfolio Perspectives. For the last several years, we
have been strategically reducing our share of total system units
by selling Company restaurants to existing and new franchisees
where their expertise can be leveraged to improve our overall
operating performance, while retaining Company ownership of
key U.S. and International markets. This portfolio-balancing
activity has reduced, and will continue to reduce, our reported
revenues and restaurant profits and increase the importance
of system sales as a key performance measure. We expect that
the loss of restaurant level profits from the disposal of these
stores will be largely mitigated by increased franchise fees from
stores refranchised, lower field general and administrative
expenses and reduced interest costs due to the reduction
of debt from the after-tax cash proceeds from our refranchis-
ing activities.
We currently expect to refranchise approximately 500 to 600
restaurants in 2000 compared to over 1,400 in 1999. However,
if market conditions are favorable, we may sell more restau-
rants than the current forecast. As a result of this decline, we
estimate that our 2000 refranchising gains will be significantly
less than our 1999 gains. In addition, we expect the impact of
refranchising gains to be even less significant over time as we
approach our target of approximately 20 percent Company
ownership of the total system.
25
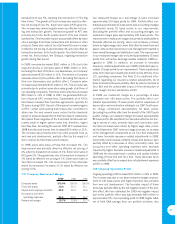
The following table summarizes our refranchising activities for the last five years:
Total 1999 1998 1997 1996 1995
Number of units refranchised 5,138 1,435 1,373 1,407 659 264
Refranchising proceeds, pre-tax $ 2,990 $ 916 $ 784 $ 770 $ 355 $ 165
Refranchising net gain, pre-tax $ 1,045 $ 422(a) $ 279(b) $ 112(c) $ 139 $ 93
(a) Includes favorable adjustments to our 1997 fourth quarter charge of $4 million.
(b) Includes unfavorable adjustments to our 1997 fourth quarter charge of $2 million.
(c) Includes a 1997 fourth quarter charge of $136 million.
In addition to our refranchising program, we have been closing restaurants over the past several years. Restaurants closed include
poor performing restaurants, restaurants that are relocated to a new site within the same trade area or U.S. Pizza Hut delivery
units consolidated with a new or existing dine-in traditional store which has been remodeled to provide dine-in, carry-out and
delivery services within the same trade area.
The following table summarizes store closure activities for the last five years:
Total 1999 1998 1997 1996 1995
Number of units closed 2,119 301 572 632 347 267
Store closure net costs $ 312 $ 13(a) $ (27)(b) $ 248(c) $40 $38
(a) Includes favorable adjustments to our 1997 fourth quarter charge of $9 million.
(b) Includes favorable adjustments to our 1997 fourth quarter charge of $56 million.
(c) Includes a 1997 fourth quarter charge of $213 million.