Pizza Hut 1999 Annual Report Download - page 42
Download and view the complete annual report
Please find page 42 of the 1999 Pizza Hut annual report below. You can navigate through the pages in the report by either clicking on the pages listed below, or by using the keyword search tool below to find specific information within the annual report.-
 1
1 -
2
-
3
-
4
-
5
-
6
-
7
-
8
-
9
-
10
-
11
-
12
-
13
-
14
-
15
-
16
-
17
-
18
-
19
-
20
-
21
-
22
-
23
-
24
-
25
-
26
-
27
-
28
-
29
-
30
-
31
-
 32
32 -
 33
33 -
 34
34 -
 35
35 -
 36
36 -
 37
37 -
 38
38 -
 39
39 -
 40
40 -
 41
41 -
 42
42 -
 43
43 -
 44
44 -
 45
45 -
 46
46 -
 47
47 -
 48
48 -
 49
49 -
 50
50 -
 51
51 -
 52
52 -
53
-
54
-
55
-
56
-
57
-
58
-
59
-
60
-
61
-
62
-
63
-
64
-
65
-
66
-
67
-
68
-
69
-
70
-
71
-
72
 |
 |

40
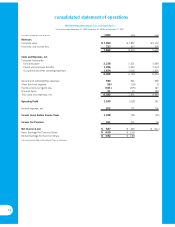
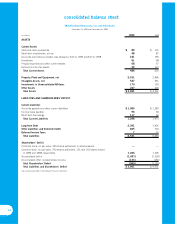
consolidated balance sheet
TRICON Global Restaurants, Inc. and Subsidiaries
December 25, 1999 and December 26, 1998
(in millions) 1999 1998
ASSETS
Current Assets
Cash and cash equivalents $89 $ 121
Short-term investments, at cost 48 87
Accounts and notes receivable, less allowance: $13 in 1999 and $17 in 1998 161 155
Inventories 61 68
Prepaid expenses and other current assets 68 57
Deferred income tax assets 59 137
Total Current Assets 486 625
Property, Plant and Equipment, net 2,531 2,896
Intangible Assets, net 527 651
Investments in Unconsolidated Affiliates 170 159
Other Assets 247 200
Total Assets $ 3,961 $ 4,531
LIABILITIES AND SHAREHOLDERS’ DEFICIT
Current Liabilities
Accounts payable and other current liabilities $ 1,085 $ 1,283
Income taxes payable 96 94
Short-term borrowings 117 96
Total Current Liabilities 1,298 1,473
Long-term Debt 2,391 3,436
Other Liabilities and Deferred Credits 825 720
Deferred Income Taxes 765
Total Liabilities 4,521 5,694
Shareholders’ Deficit
Preferred stock, no par value, 250 shares authorized; no shares issued ——
Common stock, no par value, 750 shares authorized; 151 and 153 shares issued
in 1999 and 1998, respectively 1,264 1,305
Accumulated deficit (1,691) (2,318)
Accumulated other comprehensive income (133) (150)
Total Shareholders’ Deficit (560) (1,163)
Total Liabilities and Shareholders’ Deficit $ 3,961 $ 4,531
See accompanying Notes to Consolidated Financial Statements.