Pizza Hut 1999 Annual Report Download - page 2
Download and view the complete annual report
Please find page 2 of the 1999 Pizza Hut annual report below. You can navigate through the pages in the report by either clicking on the pages listed below, or by using the keyword search tool below to find specific information within the annual report.-
 1
1 -
 2
2 -
 3
3 -
 4
4 -
 5
5 -
 6
6 -
 7
7 -
 8
8 -
 9
9 -
 10
10 -
 11
11 -
 12
12 -
 13
13 -
14
-
15
-
16
-
17
-
18
-
19
-
20
-
21
-
22
-
23
-
24
-
25
-
26
-
27
-
28
-
29
-
30
-
31
-
32
-
33
-
34
-
35
-
36
-
37
-
38
-
39
-
40
-
41
-
42
-
43
-
44
-
45
-
46
-
47
-
48
-
49
-
50
-
51
-
52
-
53
-
54
-
55
-
56
-
57
-
58
-
59
-
60
-
61
-
62
-
63
-
64
-
65
-
66
-
67
-
68
-
69
-
70
-
71
-
72
 |
 |

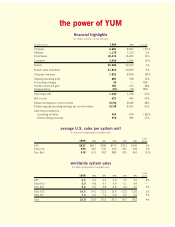
the power of YUMthe power of YUM
financial highlights
($ in millions, except for unit and share data)
Number of stores: 1999 1998 % change
Company 6,981 8,397 (17)%
Affiliates 1,178 1,120 5%
Franchisees 18,414 16,650 11%
Licensees 3,409 3,596 (5)%
System 29,982 29,763 1%
System sales (rounded) 21,800 20,600 6%
Company revenues 7,822 8,479 (8)%
Ongoing operating profit 881 768 15%
Accounting changes 29 —NM
Facility actions net gain 381 275 38%
Unusual items (51) (15) NM
Operating profit 1,240 1,028 21%
Net income 627 445 41%
Diluted earnings per common share $3.92 $2.84 38%
Diluted ongoing operating earnings per common share $2.58 $1.83 41%
Cash flows provided by:
Operating activities 565 674 (16)%
Refranchising proceeds 916 784 17%
average U.S. sales per system unit
$ in thousands (Compounded annual growth rates)
5-year
1999 1998 1997 1996 1995 1994 growth
KFC $837 $817 $786 $775 $733 $706 3%
Pizza Hut 696 645 630 620 651 634 2%
Taco Bell 918 931 902 886 925 953 (1)%
worldwide system sales
$ in billions (Compounded annual growth rates)
5-year
1999 1998 1997 1996 1995 1994 growth
KFC 4.3 4.2 4.0 3.9 3.7 3.5 4%
Pizza Hut 5.0 4.8 4.7 4.9 5.1 4.9 —
Taco Bell 5.2 5.0 4.8 4.6 4.4 4.2 4%
Total U.S. 14.5 14.0 13.5 13.4 13.2 12.6 3%
Total Intl 7.3 6.6 7.0 6.9 6.5 5.6 5%
Total 21.8 20.6 20.5 20.3 19.7 18.2 4%