Pizza Hut 1999 Annual Report Download - page 33
Download and view the complete annual report
Please find page 33 of the 1999 Pizza Hut annual report below. You can navigate through the pages in the report by either clicking on the pages listed below, or by using the keyword search tool below to find specific information within the annual report.-
 1
1 -
2
-
3
-
4
-
5
-
6
-
7
-
8
-
9
-
10
-
11
-
12
-
13
-
14
-
15
-
16
-
17
-
18
-
19
-
20
-
21
-
22
-
 23
23 -
 24
24 -
 25
25 -
 26
26 -
 27
27 -
 28
28 -
 29
29 -
 30
30 -
 31
31 -
 32
32 -
 33
33 -
 34
34 -
 35
35 -
 36
36 -
 37
37 -
 38
38 -
 39
39 -
 40
40 -
 41
41 -
 42
42 -
 43
43 -
44
-
45
-
46
-
47
-
48
-
49
-
50
-
51
-
52
-
53
-
54
-
55
-
56
-
57
-
58
-
59
-
60
-
61
-
62
-
63
-
64
-
65
-
66
-
67
-
68
-
69
-
70
-
71
-
72
 |
 |

transactions of over 5%, resulting from the launch of “The Big
New Yorker.” The growth at Pizza Hut was also aided by effec-
tive net pricing of over 3%. Same store sales at KFC grew 2%.
The increase was almost equally driven by effective net pric-
ing and transaction growth. Transaction growth at KFC was
primarily due to the fourth quarter launch of its new chicken
sandwiches. This favorable impact was partially offset by lower
check averages from these transactions and declines in other
products. Same store sales at Taco Bell were flat as an increase
in effective net pricing of approximately 4% was fully offset by
transaction declines. In the fourth quarter, Taco Bell introduced
a new hot, fried product, the Chalupa, reigniting transaction
growth during that period.
In 1998, revenues decreased $931 million or 13% due to the
expected decline in Company sales of $981 million or 14%.
Excluding the effect of the Non-core Businesses, our Company
sales decreased $715 million or 11%. The decline in Company
sales was driven by the portfolio effect. Excluding the impact of
Non-core Businesses and portfolio effect, Company sales
increased approximately $331 million or 6%. This increase was
primarily due to positive same store sales growth at all three of
our operating companies. Franchise and license fees increased
$50 million or 13% in 1998. In 1997, we generated $24 mil-
lion of special KFC renewal fees. Substantially all of KFC’s
franchisees renewed their franchise agreements, typically for
20 years, during 1997. As part of this special renewal program
at KFC, certain participating franchisees also committed to
attain over the next several years certain facility standards
based on physical assessment of that franchisee’s restaurants.
We believe these upgrades of the franchised facilities will ulti-
mately result in higher system sales and, therefore, higher
franchise fees. Excluding the special 1997 KFC renewal fees,
1998 franchise and license fees increased $74 million or 21%.
The increase was primarily driven by units acquired from us
and new unit development, partially offset by the impact of
store closures by franchisees and licensees.
In 1998, same store sales at Pizza Hut increased 6%. The
improvement was primarily driven by effective net pricing of
4% aided by transaction increases of 2%. Same store sales at
KFC grew 3%. This growth was due to transaction increases of
2% aided by effective net pricing of 1%. Same store sales at
Taco Bell increased 3%. The improvement at Taco Bell was
driven by transaction increases of 1% aided by effective net
pricing of 2%.
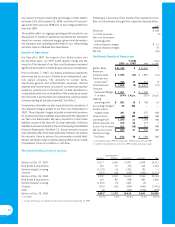
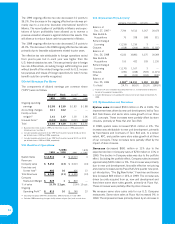
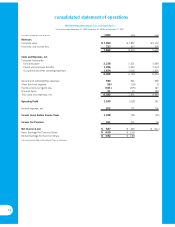
U.S. Company Restaurant Margin
1999 1998 1997
Company sales 100.0% 100.0% 100.0%
Food and paper 30.0 31.0 31.1
Payroll and employee benefits 29.8 30.4 30.5
Occupancy and other
operating expenses 24.5 25.0 26.7
Restaurant margin 15.7% 13.6% 11.7%
Our restaurant margin as a percentage of sales increased
approximately 210 basis points for 1999. Portfolio effect con-
tributed approximately 45 basis points and accounting changes
contributed nearly 25 basis points to our improvement.
Excluding the portfolio effect and accounting changes, our
restaurant margin grew approximately 140 basis points. The
improvement in restaurant margin was primarily attributable to
favorable effective net pricing. Labor cost increases, primarily
driven by higher wage rates, were fully offset by lower food and
paper costs as improved product cost management resulted in
lower overall beverage and distribution costs. The improvement
in our restaurant margin also included approximately 15 basis
points from retroactive beverage rebates related to 1998 rec-
ognized in 1999. In addition, an increase in favorable
insurance-related adjustments over 1998 contributed approx-
imately 10 basis points to our improvement. These adjustments
arose from improved casualty loss trends across all three of our
U.S. operating companies. See Note 21 for additional infor-
mation regarding our insurance-related adjustments. All of
these improvements were partially offset by volume declines at
Taco Bell and the unfavorable impact of the introduction of
lower margin chicken sandwiches at KFC.
In 1998, our restaurant margin as a percentage of sales
increased over 190 basis points. The portfolio effect con-
tributed approximately 75 basis points and the suspension of
depreciation and amortization relating to our 1997 fourth quar-
ter charge contributed approximately 40 basis points.
Excluding the portfolio effect and the benefit of the 1997 fourth
quarter charge, our restaurant margin increased approximately
80 basis points. We benefited from favorable effective net pric-
ing in excess of costs, primarily labor and commodity costs.
Our labor increases were driven by higher wage rates, prima-
rily the September 1997 minimum wage increase, an increase
in the management complement at our Taco Bell restaurants
and lower favorable insurance-related adjustments in 1998.
Commodity cost increases, primarily cheese and produce, were
partially offset by a decrease in other commodity costs. Our
occupancy and other operating expenses were favorably
impacted by higher favorable insurance-related adjustments in
1998 and the decreased store condition and quality initiative
spending at Pizza Hut and Taco Bell. These favorable items
were partially offset by increased store refurbishment expenses
at KFC in 1998.
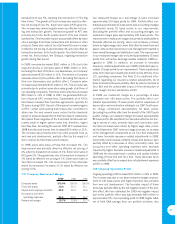
U.S. Ongoing Operating Profit
Ongoing operating profit increased $73 million or 10% in 1999.
The increase was due to our base restaurant margin improve-
ment of 140 basis points and higher franchise fees primarily
from new unit development. The favorable impact of these
items was partially offset by the net negative impact of the port-
folio effect. We have estimated the 1999 net negative impact
due to the portfolio effect was approximately $40 million or
approximately 5% of our operating profit in 1998. Higher G&A,
net of field G&A savings from our portfolio activities, also
31