Pizza Hut 1999 Annual Report Download - page 56
Download and view the complete annual report
Please find page 56 of the 1999 Pizza Hut annual report below. You can navigate through the pages in the report by either clicking on the pages listed below, or by using the keyword search tool below to find specific information within the annual report.-
 1
1 -
2
-
3
-
4
-
5
-
6
-
7
-
8
-
9
-
10
-
11
-
12
-
13
-
14
-
15
-
16
-
17
-
18
-
19
-
20
-
21
-
22
-
23
-
24
-
25
-
26
-
27
-
28
-
29
-
30
-
31
-
32
-
33
-
34
-
35
-
36
-
37
-
38
-
39
-
40
-
41
-
42
-
43
-
44
-
45
-
 46
46 -
 47
47 -
 48
48 -
 49
49 -
 50
50 -
 51
51 -
 52
52 -
 53
53 -
 54
54 -
 55
55 -
 56
56 -
 57
57 -
 58
58 -
 59
59 -
 60
60 -
 61
61 -
 62
62 -
 63
63 -
 64
64 -
 65
65 -
 66
66 -
67
-
68
-
69
-
70
-
71
-
72
 |
 |

54
counterparties, netting swap and forward rate payments within
contracts and limiting payments associated with the collars to
differences outside the collared range.
Open commodity future contracts and deferred gains and
losses at year-end 1999 and 1998, as well as gains and losses
recognized as part of cost of sales in 1999, 1998 and 1997,
were not significant.
Fair Value. Excluding the financial instruments included in
the table below, the carrying amounts of our other financial
instruments approximate fair value.
The carrying amounts and fair values of TRICON’s financial
instruments are as follows:
1999 1998
Carrying Carrying
Amount Fair Value Amount Fair Value
Debt
Short-term borrowings
and long-term debt,
excluding
capital leases $ 2,411 $ 2,377 $ 3,415 $ 3,431
Debt-related derivative
instruments
Open contracts in an
(asset) liability
position — (3) 217
Debt, excluding
capital leases $ 2,411 $ 2,374 $ 3,417 $ 3,448
Guarantees $—$27$—$24
We estimated the fair value of debt, debt-related derivative
instruments and guarantees using market quotes and calcula-
tions based on market rates. See Note 2 for recently issued
accounting pronouncements relating to financial
instruments.
Pension Plans and Postretirement
Medical Benefits
We sponsor noncontributory defined benefit pen-
sion plans covering substantially all full-time U.S.
salaried employees and certain hourly employees and non-
contributory defined benefit pension plans covering certain
international employees. In addition, we provide postretirement
health care benefits to eligible retired employees and their
dependents, principally in the U.S. Salaried retirees who have
10 years of service and attain age 55 are eligible to participate
in the postretirement benefit plans; since 1994, these plans
have included retiree cost sharing provisions. We base bene-
fits generally on years of service and compensation or stated
amounts for each year of service.
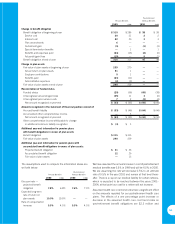
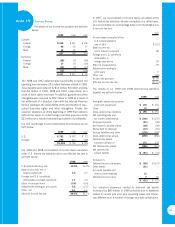
The components of net periodic benefit cost are set forth
below:
Pension Benefits
1999 1998 1997
Service cost $20 $21 $18
Interest cost 22 20 17
Expected return on plan assets (24) (21) (19)
Amortization of prior service cost 1——
Amortization of transition
(asset) obligation —(2) (4)
Recognized actuarial loss —21
Net periodic benefit cost $ 19 $ 20 $ 13
Additional loss recognized due to:
Curtailment $4 $— $—
Special termination benefits —32
Postretirement Medical Benefits
1999 1998 1997
Service cost $2 $2 $2
Interest cost 332
Amortization of prior
service cost (2) (2) (2)
Net periodic benefit cost $3 $3 $2
Additional (gain) loss
recognized due to:
Curtailment $ (1) $ (3) $ —
Special termination benefits —1—
Prior service costs are amortized on a straight-line basis over
the average remaining service period of employees expected
to receive benefits.
note 14