Pizza Hut 1999 Annual Report Download
Download and view the complete annual report
Please find the complete 1999 Pizza Hut annual report below. You can navigate through the pages in the report by either clicking on the pages listed below, or by using the keyword search tool below to find specific information within the annual report.-
 1
1 -
 2
2 -
 3
3 -
 4
4 -
 5
5 -
 6
6 -
 7
7 -
 8
8 -
 9
9 -
 10
10 -
 11
11 -
 12
12 -
13
-
14
-
15
-
16
-
17
-
18
-
19
-
20
-
21
-
22
-
23
-
24
-
25
-
26
-
27
-
28
-
29
-
30
-
31
-
32
-
33
-
34
-
35
-
36
-
37
-
38
-
39
-
40
-
41
-
42
-
43
-
44
-
45
-
46
-
47
-
48
-
49
-
50
-
51
-
52
-
53
-
54
-
55
-
56
-
57
-
58
-
59
-
60
-
61
-
62
-
63
-
64
-
65
-
66
-
67
-
68
-
69
-
70
-
71
-
72
 |
 |

1999 annual report
Table of contents
-
Page 1
1999 annual report -
Page 2
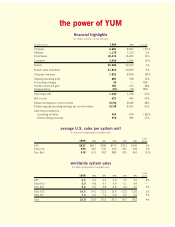
... and share data) Number of stores: 1999 6,981 1,178 18,414 3,409 29,982 21,800 7,822 881 29 381 (51) 1,240 627 $3.92 $2.58 565 916 1998 % change Company Afï¬liates Franchisees Licensees System System sales (rounded) Company revenues Ongoing operating proï¬t Accounting changes Facility actions... -
Page 3
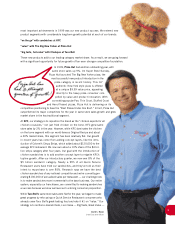
..., demonstrating our Passion the way we start all of our major system meetings - with a "YUM Cheer!" Give me a "Y"! Give me a "U"! Give me a "M"! David Alston KFC Restaurant General Manager Jackie Lopez Pizza Hut Restaurant General Manager Carlos Diaz Taco Bell Franchise Restaurant General Manager 1 -
Page 4
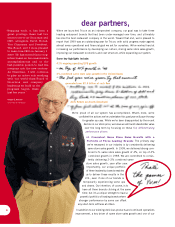
... been under-managed over time, and ultimately become the best restaurant company in the world. Toward that end, we're pleased to report that 1999 was an outstanding year for Tricon, with solid progress made against almost every operational and ï¬nancial goal we set for ourselves. We've worked hard... -
Page 5
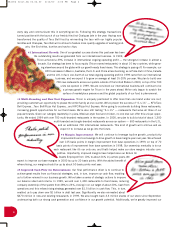
...outstanding year, with same store sales up 9%. On Super Bowl Sunday, Pizza Hut launched The Big New Yorker pizza, the most successful new product introduction in the pizza category in recent history. This 16" authentic New York style pizza is offered at a unique $9.99 value price, appealing directly... -
Page 6
...are booming, as is Pizza Hut in China, Canada and the U.K. In fact, one-fourth of our total ongoing operating proï¬t in 1999 came from our international business, and we expect it to grow on average at least 15-20% per year. We plan to build over 700 new restaurants across our system outside of the... -
Page 7
... cover, we've featured three of our Restaurant General Managers - our #1 leaders - who represent a system built around restaurant teams committed to serving customers better than anyone. David Alston (KFC), Jackie Lopez (Pizza Hut) and Carlos Diaz (Taco Bell) are demonstrating our "YUM Cheer" - the... -
Page 8
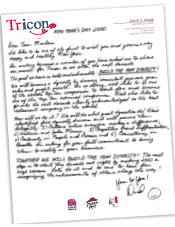
cer Chief Executive Ofï¬ urants, Inc. Tricon Global Resta PO Box 32220 2-2220 Louisville, KY 4023 David C. Novak -
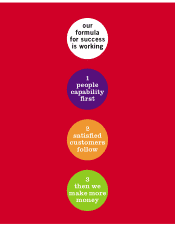
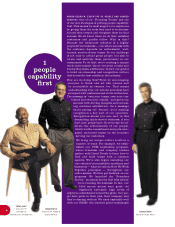
Page 9
our formula for success is working 1 people capability ï¬rst 2 satisï¬ed customers follow 3 then we make more money -
Page 10
... We Work Together principles - throughout our entire system. We then get feedback on our progress. We launched the "Founders Survey," an annual survey that tells us how we're running the business. In fact, our 1999 survey scores were great: we registered extremely high levels of employee commitment... -
Page 11
... best at driving their business with a passion toward putting YUMs on customers' faces around the world. (from back to front) Jackie Lopez, Pizza Hut RGM, Big Cheese Award; Goh Kim Yian, KFC Market Manager, Globe Award; Carlos Delgado, KFC RGM, Bulldog Award; Henry Yip, Pizza Hut Franchise General... -
Page 12
... charged-up, customer-focused teams and dynamite sales - as well as improved operations. And though C.H.A.M.P.S. started out at our international business, TRI, we've since spread it across the entire system - ï¬rst to KFC then to Taco Bell, and we recently rolled it out to Pizza Hut last year. And... -
Page 13
...walking the talk of community service by creating and sponsoring programs that support our customers across the globe. Pizza Hut's BOOK IT!® National Reading Incentive Program encourages 20 million kids every year to learn the joy of reading. Taco Bell's TEENSupreme Program, in partnership with the... -
Page 14
... barrier-busting price points, this breakthrough product was and remains an enormous customer win. Of course, we also know that great service and great operations also drive sales. So this past year, for the ï¬rst time we brought together every one of our Restaurant General Managers at a landmark... -
Page 15
Pizza QSR Sales 21% 12% 7% 6% 7% 47% Pizza Hut Domino's Little Caesar's Papa John's Regionals Independents* *Highly fragmented Mike Rawlings President & Chief Concept Ofï¬cer Mike Miles Chief Operating Ofï¬cer 13 -
Page 16
14 -
Page 17
...all-time highs. We also introduced programs to help make sandwiches successful operationally. With special equipment and an intense focus on training and recognition, we successfully added "freshly made" sandwiches to our restaurants while simplifying operations and improving service speed. Speed is... -
Page 18
... the foundation to become America's Favorite Quick Service Restaurant through great-tasting new Mexican food, value leadership, consistent customer satisfaction, and expanded points of access! Last year we took our customer mania to a new level with Chalupas. This signature product scored off the... -
Page 19
Mexican QSR Sales 72% 3% 3% 2% 2% 18% Taco Bell Del Taco Taco John's Taco Bueno Taco Time Independents Peter Waller President & Chief Concept Ofï¬cer Bob Nilsen Chief Operating Ofï¬cer 17 -
Page 20
... large markets (Australia, the United Kingdom, Korea) and has been a terriï¬c success. Pizza Hut introduced its version of the Big New Yorker in Europe with hopes it will be big internationally. The addition of our new franchise partners has allowed us to continue to build a solid franchise system... -
Page 21
Peter Hearl Executive Vice President Pete Bassi President International System Sales By Brand 63% KFC 35% Pizza Hut 2% Taco Bell 19 -
Page 22
... while working to improve return on company assets in the key countries in which we operate. MARK COSBY, CHIEF DEVELOPMENT OFFICER: Fourth, we're also building and upgrading more stores. Over the last two years, we built a new unit growth machine and completed a plan for every market and trade area... -
Page 23
... system - everything from cheese to restaurant signs - resulting in substantial savings that allowed us to absorb inï¬,ation and increased costs from product promotions and introductions. C O U N S E L A N D S E C R E TA RY: We are also working with our franchise partners and the Pepsi-Cola company... -
Page 24
Tricon facts U.S. Sales by Daypart (% of Sales) U.S. Sales by Distribution Channel (% of Sales) Sources of System Sales in International Restaurants SNACKS BREAKFAST 2% LUNCH 24% DINE OUT 63% GREATER CHINA 11% DINE IN 37% AMERICAS 21% EUROPE S. AFRICA 25% ASIA PACIFIC 43% DINNER 74% SNACKS ... -
Page 25
...to reï¬,ect the transfer of management responsibility. breakdown of worldwide system units Year-end 1999 unconsolidated afï¬liates company franchised licensed total U.S. KFC Pizza Hut Taco Bell Total U.S. International KFC Pizza Hut Taco Bell Total International Total 1,439 2,355 1,190 4,984... -
Page 26
...is comprised of the worldwide operations of KFC, Pizza Hut and Taco Bell (the "Core Business(es)") and is the world's largest quick service restaurant ("QSR") company based on the number of system units. Separately, each brand ranks in the top ten among QSR chains in U.S. system sales and units. Our... -
Page 27
... years, we have been strategically reducing our share of total system units by selling Company restaurants to existing and new franchisees where their expertise can be leveraged to improve our overall operating performance, while retaining Company ownership of key U.S. and International markets... -
Page 28
... of Operations % B(W) 1999 vs. 1998 1998 % B(W) vs. 1997 System Sales $ 21,762 6 Revenues Company sales $ 7,099 (10) Franchise and 723 15 license fees(1) Total Revenues $ 7,822 (8) Company Restaurant Margin $ 1,091 3 % of sales 15.4% 1.9 ppts). Ongoing operating proï¬t $ 881 15 Accounting changes... -
Page 29
..., primarily labor in the U.S. Restaurant margin also beneï¬ted from improved food and paper cost management in both the U.S. and key International equity markets. Volume increases at Pizza Hut in the U.S. and in key International equity markets were fully offset by volume declines at Taco Bell and... -
Page 30
... expenses as an independent, publicly owned company and incurred additional expenses Worldwide Facility Actions Net (Gain) Loss related to continuing efforts to improve and standardize administrative and accounting systems. Worldwide Other (Income) Expense % B(W) 1999 vs. 1998 1998 % B(W) vs... -
Page 31
... an independent, publicly owned company, as well as, additional expenses related to the efforts to improve and standardize operating, administrative and accounting systems. Worldwide Interest Expense, Net 1999 1998 1997 Reported Income taxes Effective tax rate Ongoing(a) Income taxes Effective tax... -
Page 32
...effective net pricing and volume increases led by Pizza Hut's ï¬rst quarter new product introduction, "The Big New Yorker." Franchise and license fees increased $69 million or 16% in 1999. The increase was driven by units acquired from us, new unit development and franchisee same store sales growth... -
Page 33
... points. We beneï¬ted from favorable effective net pricing in excess of costs, primarily labor and commodity costs. Our labor increases were driven by higher wage rates, primarily the September 1997 minimum wage increase, an increase in the management complement at our Taco Bell restaurants and... -
Page 34
... included in the charge. International Results of Operations 1999 Amount % B(W) vs. 1998 10 - 13 2 Amount 1998 % B(W) vs. 1997 System Sales Revenues Company sales Franchise and license fees Total Revenues Company Restaurant Margin % of sales Ongoing Operating Proï¬t(1) (1) $ 7,246 $ 1,846 228... -
Page 35
... expected, the refranchising of our restaurants and the related increase in franchised units have caused accounts receivable for franchise fees to increase. Company sales Food and paper Payroll and employee beneï¬ts Occupancy and other operating expenses Restaurant margin 100.0% 36.0 21.0 28.6 14... -
Page 36
...Company restaurants. The decline was driven by our portfolio activities. Cash provided by investing activities increased $220 million to $522 million in 1999. The majority of the increase is due to higher gross refranchising proceeds and proceeds from the sale of international short-term investments... -
Page 37
... franchise community are working closely together to proactively address the bankruptcy situation and develop appropriate contingency plans. It is our intention to take all actions reasonably necessary and prudent to ensure continued supply of restaurant products and equipment to the TRICON system... -
Page 38
...non-information technology systems with embedded technology applications (ET) for the 36 Year 2000 issue. We also took actions we believed would mitigate our Year 2000 risks related to our critical business partners including suppliers, banks, franchisees and other service providers (primarily data... -
Page 39
... our strategy to reduce the percentage of system units we operate; volatility of actuarially determined casualty loss estimates and adoption of new or changes in accounting policies and practices. Industry risks and uncertainties include, but are not limited to, global and local business, economic... -
Page 40
... TRICON Global Restaurants, Inc. and Subsidiaries Fiscal years ended December 25, 1999, December 26, 1998 and December 27, 1997 (in millions, except per share amounts) 1999 $ 7,099 723 7,822 1998 1997 Revenues Company sales Franchise and license fees $ 7,852 627 8,479 $ 9,112 578 9,690 Costs... -
Page 41
... current liabilities Income taxes payable Net change in operating working capital Net Cash Provided by Operating Activities Cash Flows - Investing Activities Capital spending Refranchising of restaurants Acquisition of restaurants Sales of Non-core Businesses Sales of property, plant and equipment... -
Page 42
... 1999 1998 ASSETS Current Assets Cash and cash equivalents Short-term investments, at cost Accounts and notes receivable, less allowance: $13 in 1999 and $17 in 1998 Inventories Prepaid expenses and other current assets Deferred income tax assets Total Current Assets Property, Plant and Equipment... -
Page 43
consolidated statement of shareholders' (deï¬cit) equity and comprehensive income TRICON Global Restaurants, Inc. and Subsidiaries Fiscal years ended December 25, 1999, December 26, 1998 and December 27, 1997 (in millions) Issued Common Stock Shares Amount Accumulated Investments by Other ... -
Page 44
... "we" or "us." Our worldwide businesses, KFC, Pizza Hut and Taco Bell ("Core Business(es)"), include the operations, development and franchising or licensing of a system of both traditional and non-traditional quick service restaurant units. Our traditional restaurants feature dine-in, carryout and... -
Page 45
... Statement of Operations, which include costs of advertising and other marketing activities. We charge direct marketing costs to expense ratably in relation to revenues over the year in which incurred. Direct marketing costs deferred at year-end consist of media and related ad production costs. We... -
Page 46
... to pay an initial, non-refundable fee. Our agreements also require continuing fees based upon a percentage of sales. Subject to our approval and payment of a renewal fee, a franchisee may generally renew its agreement upon its expiration. Our direct costs of the sales and servicing of franchise and... -
Page 47
... We evaluate restaurants using a "two-year history of operating losses" as our primary indicator of potential impairment. Based on the best information available, we write down an impaired restaurant to its estimated fair market value, which becomes its new cost basis. We generally measure estimated... -
Page 48
...greater than the average market price of our Common Stock during the year. We have omitted EPS data for the year ended December 27, 1997 since we were not an independent, publicly owned company with a capital structure of our own for the entire year. Items Affecting Comparability of Net Income (Loss... -
Page 49
... our investment strategies would be equally divided between U.S. government securities and high-quality corporate ï¬xed income securities. The pension discount methodology change resulted in a one-time increase in our 1999 operating proï¬t of approximately $6 million. Human Resource and Accounting... -
Page 50
... provided by operations. Through December 25, 1999, the amounts used apply only to the actions covered by the charge. The components of the 1997 fourth quarter charge are detailed below: U.S. International Worldwide end of the respective periods ceased when the stores were refranchised, closed or... -
Page 51
...Total Total U.S. Refranchising net gains(a) Store closure net costs Impairment charges for stores that will continue to be used in the business Impairment charges for stores to be closed in the future Facility actions net (gain) loss International Refranchising net gains(a) Store closure net costs... -
Page 52
... disposal (which include stores, our idle processing facility in Wichita, Kansas and a minority interest investment in a non-core business in 1998) by reportable operating segment as of December 25, 1999 and December 26, 1998 were as follows: 1999 1998 U.S. International Total $ $ 40 - 40 $ 111... -
Page 53
... Businesses held for disposal to estimated market value, less costs to sell; and (3) charges relating to the estimated costs of settlement of certain wage and hour litigation and the associated defense and other costs incurred. Intangible Assets, net 1999 1998 note 9 note 6 Reacquired franchise... -
Page 54
... collars. See Note 13 for a discussion of our use of derivative instruments, our management of inherent credit risk and fair value information related to debt and interest rate swaps. At December 25, 1999, we had unused borrowings available under the Revolving Credit Facility of $1.9 billion, net... -
Page 55
... leases require us to pay related executory costs, which include property taxes, maintenance and insurance. Future minimum commitments and sublease receivables under non-cancelable leases are set forth below: Commitments Capital Operating Sublease Receivables Direct Financing Operating 2000 2001... -
Page 56
... forward rate payments within contracts and limiting payments associated with the collars to differences outside the collared range. Open commodity future contracts and deferred gains and losses at year-end 1999 and 1998, as well as gains and losses recognized as part of cost of sales in 1999, 1998... -
Page 57
...an ultimate rate of 5.5% in the year 2001 and remain at that level thereafter. There is a cap on our medical liability for certain retirees, which is expected to be reached between the years 2001- 2004; at that point our cost for a retiree will not increase. Assumed health care cost trend rates have... -
Page 58
... in the assumed health care cost trend rates on total service and interest cost components are not signiï¬cant. At the end of 1998, we changed the method for determining our pension and postretirement medical beneï¬t discount rate to better reï¬,ect the assumed investment strategies we would most... -
Page 59
.... In late 1997, we introduced a new investment option for the EID Plan allowing participants to defer certain incentive compensation into the purchase of phantom shares of our Common Stock at a 25% discount from the average market price at the date of deferral (the "Discount Stock Account... -
Page 60
... Businesses. We recognized as compensation expense our total matching contribution of $4 million and $1 million in 1999 and 1998, respectively. Shareholders' Rights Plan note 17 On July 21, 1998, our Board of Directors declared a dividend distribution of one right for each share of Common Stock... -
Page 61
... U.S. federal tax statutory rate to our effective tax rate is set forth below: 1999 1998 Intangible assets and property, plant and equipment Other Gross deferred tax liabilities Net operating loss and tax credit carryforwards Employee beneï¬ts Self-insured casualty claims Stores held for disposal... -
Page 62
... were sold in 1997 prior to the Spin-off. KFC, Pizza Hut and Taco Bell operate throughout the U.S. and 84, 87 and 14 countries and territories outside the U.S., respectively. Principal international markets include Australia, Canada, China, Japan and the U.K. At year-end 1999, we had 10 investments... -
Page 63
...large retention limit. Based on our historical casualty loss experience over the past ten years, we believe that the combination of the annual risk of loss that we retained and the lower insurance premium costs under the new program should be less than the average total costs incurred under the old... -
Page 64
... managers purporting to represent all current and former Taco Bell restaurant general managers and assistant restaurant general managers in California. The lawsuit alleges violations of California wage and hour laws involving unpaid overtime wages. The complaint also includes an unfair business... -
Page 65
...unpaid wage and hour allegations by opening a claims process to all putative class members prior to certiï¬cation of the class. In this cure process, Taco Bell has currently paid out less than $1 million. On January 26, 1999, the Court certiï¬ed a class of all current and former shift managers and... -
Page 66
...bankruptcy unsecured creditors. The interest rate is prime plus 4%. To help ensure that our supply chain continues to remain open, we have begun to purchase (and take title to) supplies directly from suppliers (the "temporary direct purchase program") for use in our restaurants as well as for resale... -
Page 67
... Data (Unaudited) 1999 First Quarter Second Quarter Third Quarter Fourth Quarter Total Revenues: Company sales Franchise and license fees Total revenues Total costs and expenses Operating proï¬t Net income Diluted earnings per common share Operating proï¬t (loss) attributable to: Accounting... -
Page 68
... Global Restaurants, Inc. and Subsidiaries ("TRICON") as of December 25, 1999 and December 26, 1998, and the related consolidated statements of operations, cash ï¬,ows and shareholders' (deï¬cit) equity and comprehensive income for each of the years in the three-year period ended December 25, 1999... -
Page 69
... Total debt Investments by and advances from PepsiCo Other Data: Number of stores at year-end(1) Company Unconsolidated Afï¬liates Franchisees Licensees System U.S. Company same store sales growth(1) KFC Pizza Hut Taco Bell Blended Shares outstanding at year-end (in millions) Market price per share... -
Page 70
... Auditors KPMG LLP 400 West Market Street, Suite 2600 Louisville, KY 40202 Telephone: (502) 587-0535 capital stock information Stock Trading Symbol - YUM The New York Stock Exchange is the principal market for Tricon Common Stock. Shareholders At year-end 1999, there were approximately 156... -
Page 71
... Executive Vice President Tricon Restaurants International Aylwin B. Lewis 45 Executive Vice President Operations and New Business Development, Tricon Michael A. Miles 38 Chief Operating Ofï¬cer Pizza Hut USA Robert T. Nilsen 40 Chief Operating Ofï¬cer Taco Bell USA Charles E. Rawley 49 President... -
Page 72
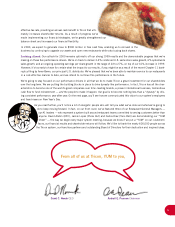
Best pizzas under one roof! We do chicken right! Grande Taste. Loco Value. Alone we're delicious, together we're YUM! hungry for more information? contact: www.triconglobal.com