Pitney Bowes 2014 Annual Report Download - page 96
Download and view the complete annual report
Please find page 96 of the 2014 Pitney Bowes annual report below. You can navigate through the pages in the report by either clicking on the pages listed below, or by using the keyword search tool below to find specific information within the annual report.-
 1
1 -
2
-
3
-
4
-
5
-
6
-
7
-
8
-
9
-
10
-
11
-
12
-
13
-
14
-
15
-
16
-
17
-
18
-
19
-
20
-
21
-
22
-
23
-
24
-
25
-
26
-
27
-
28
-
29
-
30
-
31
-
32
-
33
-
34
-
35
-
36
-
37
-
38
-
39
-
40
-
41
-
42
-
43
-
44
-
45
-
46
-
47
-
48
-
49
-
50
-
51
-
52
-
53
-
54
-
55
-
56
-
57
-
58
-
59
-
60
-
61
-
62
-
63
-
64
-
65
-
66
-
67
-
68
-
69
-
70
-
71
-
72
-
73
-
74
-
75
-
76
-
77
-
78
-
79
-
80
-
81
-
82
-
83
-
84
-
85
-
 86
86 -
 87
87 -
 88
88 -
 89
89 -
 90
90 -
 91
91 -
 92
92 -
 93
93 -
 94
94 -
 95
95 -
 96
96 -
 97
97 -
 98
98 -
 99
99 -
 100
100 -
 101
101 -
 102
102 -
 103
103 -
 104
104 -
 105
105 -
 106
106 -
107
-
108
 |
 |

PITNEY BOWES INC.
NOTES TO CONSOLIDATED FINANCIAL STATEMENTS
(Tabular dollars in thousands, except per share amounts)
86
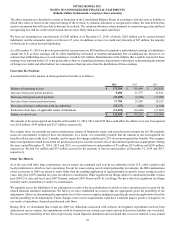
21. Quarterly Financial Data (unaudited)
First
Quarter
Second
Quarter
Third
Quarter
Fourth
Quarter Total
2014
Revenue $ 937,497 $ 958,450 $ 941,644 $ 983,913 $ 3,821,504
Cost of revenues 409,866 423,159 421,544 426,222 1,680,791
Operating expenses 473,129 396,814 378,563 461,011 1,709,517
Income from continuing operations before income taxes 54,502 138,477 141,537 96,680 431,196
Provision for income taxes 8,036 46,335 25,310 33,134 112,815
Income from continuing operations 46,466 92,142 116,227 63,546 318,381
Income from discontinued operations 2,801 6,717 20,655 3,576 33,749
Net income before attribution of noncontrolling interests 49,267 98,859 136,882 67,122 352,130
Less: Preferred stock dividends of subsidiaries attributable to
noncontrolling interests 4,594 4,594 4,593 4,594 18,375
Net income - Pitney Bowes Inc. $ 44,673 $ 94,265 $ 132,289 $ 62,528 $ 333,755
Amounts attributable to common stockholders:
Income from continuing operations $ 41,872 $ 87,548 $ 111,634 $ 58,952 $ 300,006
Income from discontinued operations 2,801 6,717 20,655 3,576 33,749
Net income - Pitney Bowes Inc. $ 44,673 $ 94,265 $ 132,289 $ 62,528 $ 333,755
Basic earnings per share attributable to common stockholders (1):
Continuing operations $ 0.21 $ 0.43 $ 0.55 $ 0.29 $ 1.49
Discontinued operations 0.01 0.03 0.10 0.02 0.17
Net income - Pitney Bowes Inc. $ 0.22 $ 0.47 $ 0.65 $ 0.31 $ 1.65
Diluted earnings per share attributable to common stockholders (1):
Continuing operations $ 0.21 $ 0.43 $ 0.55 $ 0.29 $ 1.47
Discontinued operations 0.01 0.03 0.10 0.02 0.17
Net income - Pitney Bowes Inc. $ 0.22 $ 0.46 $ 0.65 $ 0.31 $ 1.64
(1) The sum of the earnings per share amounts may not equal the totals due to rounding.