Pitney Bowes 2014 Annual Report Download - page 30
Download and view the complete annual report
Please find page 30 of the 2014 Pitney Bowes annual report below. You can navigate through the pages in the report by either clicking on the pages listed below, or by using the keyword search tool below to find specific information within the annual report.-
 1
1 -
2
-
3
-
4
-
5
-
6
-
7
-
8
-
9
-
10
-
11
-
12
-
13
-
14
-
15
-
16
-
17
-
18
-
19
-
 20
20 -
 21
21 -
 22
22 -
 23
23 -
 24
24 -
 25
25 -
 26
26 -
 27
27 -
 28
28 -
 29
29 -
 30
30 -
 31
31 -
 32
32 -
 33
33 -
 34
34 -
 35
35 -
 36
36 -
 37
37 -
 38
38 -
 39
39 -
 40
40 -
41
-
42
-
43
-
44
-
45
-
46
-
47
-
48
-
49
-
50
-
51
-
52
-
53
-
54
-
55
-
56
-
57
-
58
-
59
-
60
-
61
-
62
-
63
-
64
-
65
-
66
-
67
-
68
-
69
-
70
-
71
-
72
-
73
-
74
-
75
-
76
-
77
-
78
-
79
-
80
-
81
-
82
-
83
-
84
-
85
-
86
-
87
-
88
-
89
-
90
-
91
-
92
-
93
-
94
-
95
-
96
-
97
-
98
-
99
-
100
-
101
-
102
-
103
-
104
-
105
-
106
-
107
-
108
 |
 |

20
Digital Commerce Solutions:
Digital Commerce Solutions: Includes the worldwide revenue and related expenses from (i) the sale of non-equipment-based mailing,
customer information management, location intelligence and customer engagement solutions and related support services; (ii)
shipping and global ecommerce solutions; and (iii) direct marketing services for targeted clients.
Segment earnings before interest and taxes (EBIT) is determined by deducting from segment revenue the related costs and expenses
attributable to the segment. Segment EBIT excludes interest, taxes, general corporate expenses, restructuring charges and asset impairment
charges, which are not allocated to a particular business segment. Management uses segment EBIT to measure profitability and performance
at the segment level. Management believes segment EBIT provides investors with a useful measure of our operating performance and
underlying trends of the businesses. Segment EBIT may not be indicative of our overall consolidated performance and therefore, should
be read in conjunction with our consolidated results of operations. Refer to Note 2 to the Consolidated Financial Statements for a
reconciliation of segment EBIT to income from continuing operations before income taxes.
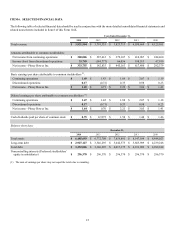
Revenue and EBIT by business segment are presented in the tables below.
Revenue
Year Ended December 31, % change
2014 2013 2012 2014 2013
North America Mailing $ 1,492 $ 1,555 $ 1,644 (4)% (5)%
International Mailing 573 603 602 (5)% —%
Small & Medium Business Solutions 2,065 2,158 2,246 (4)% (4)%
Production Mail 462 512 480 (10)% 6%
Presort Services 457 430 430 6% —%
Enterprise Business Solutions 919 942 910 (2)% 3%
Digital Commerce Solutions 838 691 668 21 % 4%
Total $ 3,822 $ 3,791 $ 3,824 1% (1)%
EBIT
Year Ended December 31, % change
2014 2013 2012 2014 2013
North America Mailing $ 642 $ 641 $ 647 —% (1)%
International Mailing 89 71 76 24 % (6)%
Small & Medium Business Solutions 731 712 723 3% (1)%
Production Mail 48 55 49 (14)% 12 %
Presort Services 98 83 106 18 % (22)%
Enterprise Business Solutions 146 138 155 5% (11)%
Digital Commerce Solutions 84 55 53 53 % 3%
Total $ 961 $ 905 $ 931 6% (3)%
Small & Medium Business Solutions
North America Mailing
North America Mailing revenue decreased 4% in 2014 compared to 2013. This decrease was due to lower rentals revenue and support
services revenue due to a decline in the number of installed meters in service and lower equipment sales primarily due to a temporary
distraction due to the transition to an inside sales organization and reassignment of accounts and resources. Financing revenue also
declined due to lower equipment sales in current and prior years, but was offset by higher supply sales due to sales efficiencies and