Pitney Bowes 2014 Annual Report Download - page 65
Download and view the complete annual report
Please find page 65 of the 2014 Pitney Bowes annual report below. You can navigate through the pages in the report by either clicking on the pages listed below, or by using the keyword search tool below to find specific information within the annual report.-
 1
1 -
2
-
3
-
4
-
5
-
6
-
7
-
8
-
9
-
10
-
11
-
12
-
13
-
14
-
15
-
16
-
17
-
18
-
19
-
20
-
21
-
22
-
23
-
24
-
25
-
26
-
27
-
28
-
29
-
30
-
31
-
32
-
33
-
34
-
35
-
36
-
37
-
38
-
39
-
40
-
41
-
42
-
43
-
44
-
45
-
46
-
47
-
48
-
49
-
50
-
51
-
52
-
53
-
54
-
 55
55 -
 56
56 -
 57
57 -
 58
58 -
 59
59 -
 60
60 -
 61
61 -
 62
62 -
 63
63 -
 64
64 -
 65
65 -
 66
66 -
 67
67 -
 68
68 -
 69
69 -
 70
70 -
 71
71 -
 72
72 -
 73
73 -
 74
74 -
 75
75 -
76
-
77
-
78
-
79
-
80
-
81
-
82
-
83
-
84
-
85
-
86
-
87
-
88
-
89
-
90
-
91
-
92
-
93
-
94
-
95
-
96
-
97
-
98
-
99
-
100
-
101
-
102
-
103
-
104
-
105
-
106
-
107
-
108
 |
 |
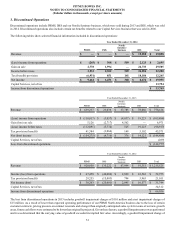
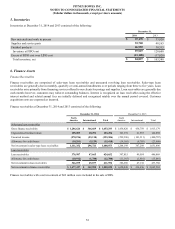
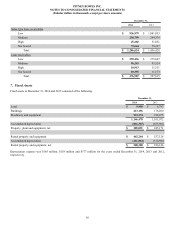
PITNEY BOWES INC.
NOTES TO CONSOLIDATED FINANCIAL STATEMENTS
(Tabular dollars in thousands, except per share amounts)
55
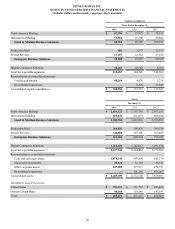
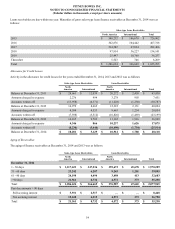
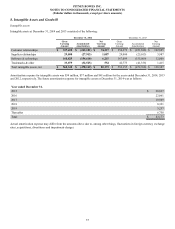
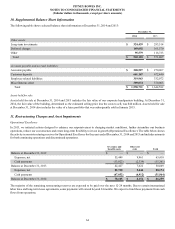
Sales-type Lease Receivables Loan Receivables
North
America International
North
America International Total
December 31, 2013
1 - 30 days $ 1,383,253 $ 425,923 $ 379,502 $ 42,573 $ 2,231,251
31 - 60 days 32,102 11,760 10,464 4,391 58,717
61 - 90 days 20,830 5,724 3,330 1,363 31,247
> 90 days 20,235 13,352 4,519 727 38,833
Total $ 1,456,420 $ 456,759 $ 397,815 $ 49,054 $ 2,360,048
Past due amounts > 90 days
Still accruing interest $ 6,413 $ 3,979 $ — $ — $ 10,392
Not accruing interest 13,822 9,373 4,519 727 28,441
Total $ 20,235 $ 13,352 $ 4,519 $ 727 $ 38,833
Credit Quality
The extension of credit and management of credit lines to new and existing clients uses a combination of an automated credit score,
where available, and a detailed manual review of the client's financial condition and, when applicable, payment history. Once credit
is granted, the payment performance of the client is managed through automated collections processes and is supplemented with direct
follow up should an account become delinquent. We have robust automated collections and extensive portfolio management processes.
The portfolio management processes ensure that our global strategy is executed, collection resources are allocated appropriately and
enhanced tools and processes are implemented as needed.
We use a third party to score the majority of the North America portfolio on a quarterly basis using a commercial credit score. We do
not use a third party to score our International portfolio because the cost to do so is prohibitive, it is a localized process and there is
no single credit score model that covers all countries.
The table below shows the North America portfolio at December 31, 2014 and 2013 by relative risk class (low, medium, high) based
on the relative scores of the accounts within each class. The relative scores are determined based on a number of factors, including
the company type, ownership structure, payment history and financial information. A fourth class is shown for accounts that are not
scored. Absence of a score is not indicative of the credit quality of the account. The degree of risk, as defined by the third party, refers
to the relative risk that an account in the next 12 month period may become delinquent.
• Low risk accounts are companies with very good credit scores and are considered to approximate the top 30% of all commercial
borrowers.
• Medium risk accounts are companies with average to good credit scores and are considered to approximate the middle 40% of
all commercial borrowers.
• High risk accounts are companies with poor credit scores, are delinquent or are at risk of becoming delinquent and are considered
to approximate the bottom 30% of all commercial borrowers.