Pitney Bowes 2014 Annual Report Download - page 94
Download and view the complete annual report
Please find page 94 of the 2014 Pitney Bowes annual report below. You can navigate through the pages in the report by either clicking on the pages listed below, or by using the keyword search tool below to find specific information within the annual report.-
 1
1 -
2
-
3
-
4
-
5
-
6
-
7
-
8
-
9
-
10
-
11
-
12
-
13
-
14
-
15
-
16
-
17
-
18
-
19
-
20
-
21
-
22
-
23
-
24
-
25
-
26
-
27
-
28
-
29
-
30
-
31
-
32
-
33
-
34
-
35
-
36
-
37
-
38
-
39
-
40
-
41
-
42
-
43
-
44
-
45
-
46
-
47
-
48
-
49
-
50
-
51
-
52
-
53
-
54
-
55
-
56
-
57
-
58
-
59
-
60
-
61
-
62
-
63
-
64
-
65
-
66
-
67
-
68
-
69
-
70
-
71
-
72
-
73
-
74
-
75
-
76
-
77
-
78
-
79
-
80
-
81
-
82
-
83
-
 84
84 -
 85
85 -
 86
86 -
 87
87 -
 88
88 -
 89
89 -
 90
90 -
 91
91 -
 92
92 -
 93
93 -
 94
94 -
 95
95 -
 96
96 -
 97
97 -
 98
98 -
 99
99 -
 100
100 -
 101
101 -
 102
102 -
 103
103 -
 104
104 -
105
-
106
-
107
-
108
 |
 |

PITNEY BOWES INC.
NOTES TO CONSOLIDATED FINANCIAL STATEMENTS
(Tabular dollars in thousands, except per share amounts)
84
number of shares to be awarded (negative discretion). PSUs are accounted for as variable awards until the end of the service period when
the grant date is established.
Total share-based compensation expense for PSUs is determined by the product of the number of shares eligible to be awarded and
expected to vest and the fair value of the award, determined using a Monte Carlo simulation model, commencing at the inception of the
requisite service period. During the performance period, the compensation expense for PSUs is re-computed using the fair value of the
award, determined using a Monte Carlo simulation model each balance sheet date. Due to the variability of these awards, significant
fluctuations in share-based compensation expense recognized from one period to the next are possible. At December 31, 2014, there was
$11 million of unrecognized compensation cost related to PSUs that will be recognized over 2.1 years.
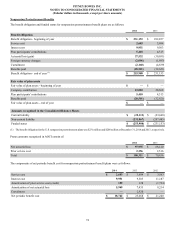
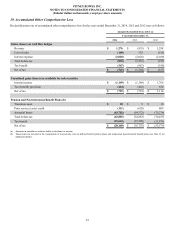
The following table summarizes information about PSUs during 2014:
Shares
PSUs outstanding - beginning of the year —
Granted 493,255
Performance adjustments 113,460
PSUs outstanding - end of the year 606,715
Stock Options
We may also grant stock options to certain officers and employees at an exercise price equal to the stock price of our common stock on
the grant date. Options vest ratably over three or four years and expire ten years from the date of grant. At December 31, 2014, there was
less than $1 million of unrecognized compensation cost related to stock options that is expected to be recognized over a weighted-average
period of 1.3 years. The intrinsic value of options outstanding and options exercisable at December 31, 2014 was $10 million and $5
million, respectively. The intrinsic value of options exercised during 2014 and 2013 was not material.
The following table summarizes information about stock option activity during 2014 and 2013:
2014 2013
Shares
Per share
weighted
average
exercise prices Shares
Per share
weighted
average exercise
prices
Options outstanding - beginning of the year 12,396,894 $ 34.90 13,653,245 $ 35.28
Granted ——
800,000 21.93
Exercised (137,072) 22.78 (35,461) 22.09
Canceled (114,925) 36.05 (628,731) 32.93
Expired (1,436,203) 40.06 (1,392,159) 32.39
Options outstanding - end of the year 10,708,694 $ 34.27 12,396,894 $ 34.90
Options exercisable - end of the year 9,808,694 $ 35.60 10,864,753 $ 36.84
The following table provides additional information about stock options outstanding and exercisable at December 31, 2014:
Options Outstanding Options Exercisable
Range of per share exercise prices Shares
Per share
weighted-average
exercise price
Weighted-average
remaining
contractual life Shares
Per share
weighted-average
exercise price
Weighted-average
remaining
contractual life
$13.39 - $22.99 2,318,742 $ 20.26 6.7 years 1,578,742 $ 20.89 6.0 years
$23.00 - $30.99 2,410,252 25.31 5.3 years 2,250,252 25.41 5.1 years
$31.00 - $45.99 3,356,418 40.30 2.2 years 3,356,418 40.30 2.2 years
$46.00 - $48.03 2,623,282 47.20 0.6 years 2,623,282 47.20 0.6 years
10,708,694 $ 34.27 3.5 years 9,808,694 $ 35.60 3.1 years