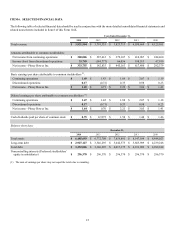
Pitney Bowes 2014 Annual Report Download - page 28
Download and view the complete annual report
Please find page 28 of the 2014 Pitney Bowes annual report below. You can navigate through the pages in the report by either clicking on the pages listed below, or by using the keyword search tool below to find specific information within the annual report.-
 1
1 -
2
-
3
-
4
-
5
-
6
-
7
-
8
-
9
-
10
-
11
-
12
-
13
-
14
-
15
-
16
-
17
-
 18
18 -
 19
19 -
 20
20 -
 21
21 -
 22
22 -
 23
23 -
 24
24 -
 25
25 -
 26
26 -
 27
27 -
 28
28 -
 29
29 -
 30
30 -
 31
31 -
 32
32 -
 33
33 -
 34
34 -
 35
35 -
 36
36 -
 37
37 -
 38
38 -
39
-
40
-
41
-
42
-
43
-
44
-
45
-
46
-
47
-
48
-
49
-
50
-
51
-
52
-
53
-
54
-
55
-
56
-
57
-
58
-
59
-
60
-
61
-
62
-
63
-
64
-
65
-
66
-
67
-
68
-
69
-
70
-
71
-
72
-
73
-
74
-
75
-
76
-
77
-
78
-
79
-
80
-
81
-
82
-
83
-
84
-
85
-
86
-
87
-
88
-
89
-
90
-
91
-
92
-
93
-
94
-
95
-
96
-
97
-
98
-
99
-
100
-
101
-
102
-
103
-
104
-
105
-
106
-
107
-
108
 |
 |

18
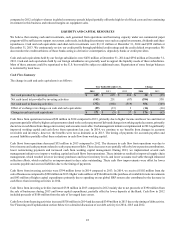
Supplies
Supplies revenue increased 5% in 2014 compared to 2013. Of this amount, 3% was due to targeted outreach to customers and favorable
pricing in our postage meter business and the remaining 2% was due to the growing base of production print equipment. Cost of supplies
as a percentage of supplies revenue was virtually unchanged at 31.2% in 2014 compared to 31.3% in 2013.
Supplies revenue increased 2% in 2013 compared to 2012 primarily due to supply sales related to the growing base of production print
equipment installations. Supplies sales for our postage meter business in 2013 were flat compared to 2012 due to higher ink sales in the
U.K. and a slowing decline in worldwide meter population trends. Cost of supplies as a percentage of supplies revenue was 31.3%
compared to 30.7% in the prior year primarily due to lower relative margins on supplies for production print equipment.
Software
Software revenue increased 8% in 2014 compared to 2013, primarily due to a 33% worldwide increase in licensing revenue. Cost of
software as a percentage of software revenue increased to 28.8% compared to 27.8% in the prior year primarily due to investments in
the specialization of the software sales channel and higher production costs.
Software revenue decreased 3% in 2013 compared to 2012 primarily due to constrained public sector spending, especially in our
international markets, and lower licensing revenue in North America. This decrease was partially offset by licensing revenue from our
digital mail delivery service offering. Cost of software as a percentage of software revenue improved slightly to 27.8% compared with
28.0% in the prior year.
Rentals
Rentals revenue decreased 5% in 2014 compared to 2013. Of this amount, 4% was due to a reduction in the number of installed meters
and clients downgrading to lower cost, less functional machines as a result of declining mail volumes. Lower rentals revenue in France
accounted for the remaining 1% decrease. Cost of rentals as a percentage of rentals revenue increased to 20.1% compared to 19.6% in
the prior year primarily due to a higher proportion of fixed costs as a percentage of revenue.
Rentals revenue decreased 5% in 2013 compared to 2012 primarily due to a decline in our installed meter base in North America and a
customer driven change in mix from rental to equipment sales in France. Cost of rentals as a percentage of rentals revenue improved to
19.6% compared with 20.3% in the prior year primarily due to lower depreciation expense.
Financing
We earn finance revenue primarily on sales-type leases from equipment sales. As a result of declining equipment sales in prior periods,
financing revenue has also been declining year-over-year. We allocate a portion of our total cost of borrowing to financing interest expense.
In computing financing interest expense, we assume a 10:1 leverage ratio of debt to equity and apply our overall effective interest rate
to the average outstanding finance receivables. Despite lower average outstanding finance receivables, financing interest expense as a
percentage of financing revenue has increased in 2014 compared to 2013 and 2013 compared to 2012 due to an increase in our overall
effective interest rate.
Support Services
Support services revenue decreased 3% in 2014 compared to 2013 primarily due to declines in our mailing business due to fewer installed
mailing machines in North America, the exit of certain non-core product lines in Norway and the transition of our business in certain
European countries to a dealer network. Cost of support services as a percentage of support services revenue improved to 60.3% in 2014
compared to 61.9% in 2013 primarily due to continued focus on expense reductions and productivity initiatives.
Support services revenue decreased 4% in 2013 compared to 2012 primarily due to a decline in equipment maintenance revenue resulting
from fewer mailing and production machines in service. Cost of support services as a percentage of support services revenue improved
slightly to 61.9% in 2013 compared to 62.2% in 2012.
Business Services
Business services revenue increased 23% in 2014 compared to 2013. Of this amount, 17% was due to higher volumes in our global
ecommerce solutions, 4% was due to higher volumes of first-class mail processed and improved operational efficiencies in our presort
business and 2% was due to higher marketing services fees due to new clients. Cost of business services as a percentage of business
services revenue improved to 70.0% in 2014 compared to 71.3% in 2013 as margin improvement in our presort operations and marketing
services more than offset our continuing investment in our global ecommerce solutions.
Business services revenue increased 6% in 2013 compared to 2012. Revenue from our global ecommerce solutions increased revenue
by 10%, but lower marketing services fees resulting from certain contract renewals decreased revenue by 4%. Cost of business services