Pitney Bowes 2014 Annual Report Download - page 9
Download and view the complete annual report
Please find page 9 of the 2014 Pitney Bowes annual report below. You can navigate through the pages in the report by either clicking on the pages listed below, or by using the keyword search tool below to find specific information within the annual report.-
 1
1 -
 2
2 -
 3
3 -
 4
4 -
 5
5 -
 6
6 -
 7
7 -
 8
8 -
 9
9 -
 10
10 -
 11
11 -
 12
12 -
 13
13 -
 14
14 -
 15
15 -
 16
16 -
 17
17 -
 18
18 -
 19
19 -
 20
20 -
21
-
22
-
23
-
24
-
25
-
26
-
27
-
28
-
29
-
30
-
31
-
32
-
33
-
34
-
35
-
36
-
37
-
38
-
39
-
40
-
41
-
42
-
43
-
44
-
45
-
46
-
47
-
48
-
49
-
50
-
51
-
52
-
53
-
54
-
55
-
56
-
57
-
58
-
59
-
60
-
61
-
62
-
63
-
64
-
65
-
66
-
67
-
68
-
69
-
70
-
71
-
72
-
73
-
74
-
75
-
76
-
77
-
78
-
79
-
80
-
81
-
82
-
83
-
84
-
85
-
86
-
87
-
88
-
89
-
90
-
91
-
92
-
93
-
94
-
95
-
96
-
97
-
98
-
99
-
100
-
101
-
102
-
103
-
104
-
105
-
106
-
107
-
108
 |
 |

7Pitney Bowes Annual Report 2014
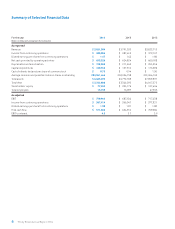
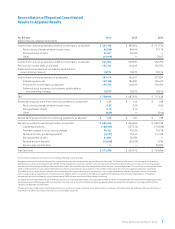
Reconciliation of Reported Consolidated
Results to Adjusted Results
For the year 2014 2013 2012
(Dollars in thousands, except per share amounts)
Income from continuing operations before income taxes, as reported $ 431,196 $ 383,954 $ 511,770
Restructuring charges and asset impairments 84,560 84,344 17,176
E
xtinguishment of debt 61,657 32,639 —
O
ther
(15,919) — 3,817
Income from continuing operations before income taxes, as adjusted
561,494 500,937 532,763
Provision for income taxes, as adjusted
155,705 116,015 136,556
Preferred stock dividends of subsidiaries attributable to
noncontrolling interests
18,375 18,375 18,376
Income from continuing operations, as adjusted
387,414 366,547 377,831
Interest expense, net
169,450 186,987 184,675
Provision for income taxes, as adjusted
155,705 116,015 136,556
Preferred stock dividends of subsidiaries attributable to
noncontrolling interests
18,375 18,375 18,376
EBIT $ 730,944 $ 687,924 $ 717,438
Diluted earnings per share from continuing operations, as reported $ 1.47 $ 1.42 $ 1.88
Restructuring charges and asset impairments 0.29 0.29 0.06
Extinguishment
of debt 0.19 0.10 —
O
ther
(0.05) — (0.06)
Diluted earnings per share from continuing operations, as adjusted $ 1.90 $ 1.81 $ 1.88
Net cash provided by operating activities, as reported $ 655,526 $ 624,824 $ 660,188
C
apital expenditures
(180,556) (137,512) (176,586)
Payments related to restructuring charges 56,162 59,520 74,718
Net tax and other (receipts) payments (5,737) 75,545 114,128
E
xtinguishment of debt 61,657 32,639 —
Reserve account deposits (15,666) (20,104) 1,636
Pension plan contributions — — 95,000
Free cash flow $ 571,386 $ 634,912 $ 769,084
The sum of the earnings per share amounts may not equal the totals due to rounding.
Management believes this presentation provides a reasonable basis on which to present the adjusted fi nancial information. The Company’s fi nancial results are reported in accordance
with generally accepted accounting principles (GAAP). The earnings per share and free cash fl ow results are adjusted to exclude the impact of special items such as restructuring charges,
debt extinguishment charges and other income and expense items that materially impact the comparability of the Company’s results of operations. The use of free cash fl ow has limitations.
GAAP cash fl ow includes all cash available to the Company after actual expenditures for all purposes. Free cash fl ow is the amount of cash that management could have available for
discretionary uses if it made di erent decisions about employing cash. It adjusts for long-term commitments such as capital expenditures, and for special items such as cash used for
restructuring charges and contributions to its pension funds. All these items use cash that is not otherwise available to the Company and are important expenditures. Management
compensates for these limitations by using a combination of GAAP cash fl ow and free cash fl ow in doing its planning.
The adjusted fi nancial information and certain fi nancial measures such as earnings before interest and taxes (EBIT) and EBIT to interest are intended to be more indicative of the ongoing operations
and economic results of the Company. EBIT excludes interest and taxes and, as a result, has the e ect of showing a greater amount of earnings than net income. In assessing performance, the
Company uses both EBIT and net income.
This adjusted fi nancial information should not be construed as an alternative to our reported results determined in accordance with GAAP. Further, our defi nition of this adjusted fi nancial
information may di er from similarly titled measures used by other companies.