Pitney Bowes 2014 Annual Report Download - page 50
Download and view the complete annual report
Please find page 50 of the 2014 Pitney Bowes annual report below. You can navigate through the pages in the report by either clicking on the pages listed below, or by using the keyword search tool below to find specific information within the annual report.-
 1
1 -
2
-
3
-
4
-
5
-
6
-
7
-
8
-
9
-
10
-
11
-
12
-
13
-
14
-
15
-
16
-
17
-
18
-
19
-
20
-
21
-
22
-
23
-
24
-
25
-
26
-
27
-
28
-
29
-
30
-
31
-
32
-
33
-
34
-
35
-
36
-
37
-
38
-
39
-
 40
40 -
 41
41 -
 42
42 -
 43
43 -
 44
44 -
 45
45 -
 46
46 -
 47
47 -
 48
48 -
 49
49 -
 50
50 -
 51
51 -
 52
52 -
 53
53 -
 54
54 -
 55
55 -
 56
56 -
 57
57 -
 58
58 -
 59
59 -
 60
60 -
61
-
62
-
63
-
64
-
65
-
66
-
67
-
68
-
69
-
70
-
71
-
72
-
73
-
74
-
75
-
76
-
77
-
78
-
79
-
80
-
81
-
82
-
83
-
84
-
85
-
86
-
87
-
88
-
89
-
90
-
91
-
92
-
93
-
94
-
95
-
96
-
97
-
98
-
99
-
100
-
101
-
102
-
103
-
104
-
105
-
106
-
107
-
108
 |
 |

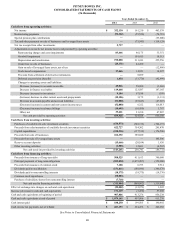
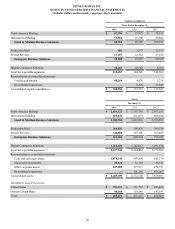
PITNEY BOWES INC.
CONSOLIDATED STATEMENTS OF CASH FLOWS
(In thousands)
40
Years Ended December 31,
2014 2013 2012
Cash flows from operating activities:
Net income $ 352,130 $ 161,210 $ 463,539
Restructuring payments (56,162) (59,520) (74,718)
Special pension plan contributions —— (95,000)
Tax and other payments on sale of businesses and leveraged lease assets —(75,545) (114,128)
Net tax receipts from other investments 5,737 ——
Adjustments to reconcile net income to net cash provided by operating activities:
Restructuring charges and asset impairments 83,466 86,175 33,351
Goodwill impairment —101,415 18,315
Depreciation and amortization 198,088 211,243 255,556
(Gain) loss on sale of businesses (28,151) 42,450 —
Gain on sale of leveraged lease assets, net of tax —— (12,886)
Stock-based compensation 17,446 14,921 18,227
Proceeds from settlement of derivative instruments —8,059 —
Deferred tax provision (benefit) 1,454 (33,770) (92,999)
Changes in operating assets and liabilities:
Decrease (increase) in accounts receivable 45,046 58,980 (3,068)
Decrease in finance receivables 119,668 123,587 147,165
Decrease (increase) in inventories 9,104 67,188 (599)
(Increase) decrease in other current assets and prepayments (10,106) 3,172 (3,131)
Decrease in accounts payable and accrued liabilities (51,080) (95,843) (47,023)
(Decrease) increase in current and non-current income taxes (52,080) 6,322 116,013
(Decrease) increase in advance billings (18,695) (16,450) 3,767
Other, net 39,661 21,230 47,807
Net cash provided by operating activities 655,526 624,824 660,188
Cash flows from investing activities:
Purchases of available-for-sale investment securities (670,573) (348,316) (304,191)
Proceeds from sales/maturities of available-for-sale investment securities 622,727 354,302 295,470
Capital expenditures (180,556) (137,512) (176,586)
Proceeds from sale of businesses 102,392 389,680 —
Proceeds from sale of leveraged lease assets —— 105,506
Reserve account deposits (15,666) (20,104) 1,636
Other investing activities (1,585) 12,691 (8,567)
Net cash (used in) provided by investing activities (143,261) 250,741 (86,732)
Cash flows from financing activities:
Proceeds from issuance of long-term debt 508,525 411,613 340,000
Principal payments of long-term obligations (599,850) (1,079,207) (550,000)
Proceeds from issuance of common stock 7,188 6,753 9,314
Dividends paid to stockholders (151,611) (188,846) (300,578)
Dividends paid to noncontrolling interests (18,375) (18,375) (18,376)
Common stock repurchases (50,003) ——
Purchase of subsidiary shares from noncontrolling interest (7,718) ——
Net cash used in financing activities (311,844) (868,062) (519,640)
Effect of exchange rate changes on cash and cash equivalents (29,082) (12,973) 3,222
Increase (decrease) in cash and cash equivalents 171,339 (5,470) 57,038
Cash and cash equivalents at beginning of period 907,806 913,276 856,238
Cash and cash equivalents at end of period $ 1,079,145 $ 907,806 $ 913,276
Cash interest paid $ 180,250 $ 199,505 $ 190,892
Cash income tax payments, net of refunds $ 203,193 $ 224,432 $ 206,285
See Notes to Consolidated Financial Statements