Pitney Bowes 2014 Annual Report Download - page 86
Download and view the complete annual report
Please find page 86 of the 2014 Pitney Bowes annual report below. You can navigate through the pages in the report by either clicking on the pages listed below, or by using the keyword search tool below to find specific information within the annual report.-
 1
1 -
2
-
3
-
4
-
5
-
6
-
7
-
8
-
9
-
10
-
11
-
12
-
13
-
14
-
15
-
16
-
17
-
18
-
19
-
20
-
21
-
22
-
23
-
24
-
25
-
26
-
27
-
28
-
29
-
30
-
31
-
32
-
33
-
34
-
35
-
36
-
37
-
38
-
39
-
40
-
41
-
42
-
43
-
44
-
45
-
46
-
47
-
48
-
49
-
50
-
51
-
52
-
53
-
54
-
55
-
56
-
57
-
58
-
59
-
60
-
61
-
62
-
63
-
64
-
65
-
66
-
67
-
68
-
69
-
70
-
71
-
72
-
73
-
74
-
75
-
 76
76 -
 77
77 -
 78
78 -
 79
79 -
 80
80 -
 81
81 -
 82
82 -
 83
83 -
 84
84 -
 85
85 -
 86
86 -
 87
87 -
 88
88 -
 89
89 -
 90
90 -
 91
91 -
 92
92 -
 93
93 -
 94
94 -
 95
95 -
 96
96 -
97
-
98
-
99
-
100
-
101
-
102
-
103
-
104
-
105
-
106
-
107
-
108
 |
 |

PITNEY BOWES INC.
NOTES TO CONSOLIDATED FINANCIAL STATEMENTS
(Tabular dollars in thousands, except per share amounts)
76
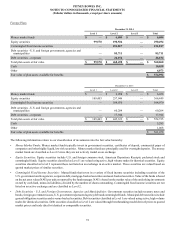
Savings Plans
We offer voluntary defined contribution plans to our U.S. employees designed to help them accumulate additional savings for retirement.
We provide a core contribution to all employees, regardless if they participate in the plan, and match a portion of each participating
employees' contribution, based on eligible pay. Total contributions to our defined contribution plans were $25 million in 2014 and $32
million in 2013.
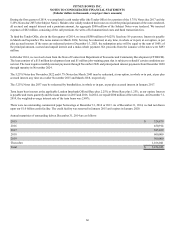
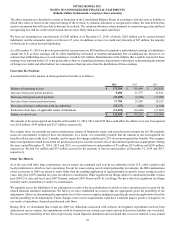
14. Income Taxes
Income from continuing operations before taxes consisted of the following:
Years Ended December 31,
2014 2013 2012
U.S. $ 356,017 $ 288,660 $ 387,987
International 75,179 95,294 123,783
Total $ 431,196 $ 383,954 $ 511,770
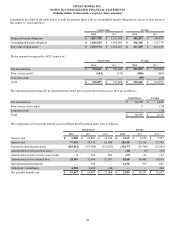
The provision for income taxes from continuing operations consisted of the following:
Years Ended December 31,
2014 2013 2012
U.S. Federal:
Current $ 71,683 $ 78,315 $ 151,984
Deferred 6,941 (19,754) 16,136
78,624 58,561 168,120
U.S. State and Local:
Current 7,186 5,359 (2,604)
Deferred (9,307) (8,026) (26,273)
(2,121) (2,667) (28,877)
International:
Current 32,492 28,063 57,906
Deferred 3,820 (5,990) (82,862)
36,312 22,073 (24,956)
Total current 111,361 111,737 207,286
Total deferred 1,454 (33,770) (92,999)
Total provision for income taxes $ 112,815 $ 77,967 $ 114,287
Effective tax rate 26.2% 20.3% 22.3%
The effective tax rate for 2014 includes tax benefits of $22 million from the resolution of tax examinations and $5 million from the
retroactive effect of 2014 U.S. tax legislation.
The effective tax rate for 2013 includes tax benefits of $13 million from an affiliate reorganization, $17 million from tax planning initiatives
and $5 million from the adjustment of non-U.S. tax accounts from prior periods and the retroactive effect of 2013 U.S. tax legislation.
The effective tax rate for 2012 includes tax benefits of $32 million from the sale of non-U.S. leveraged lease assets and $47 million from
the resolution of U.S. tax examinations and tax accruals of $43 million for the repatriation of additional non-U.S. earnings that arose as
a result of one-time events including the sale of leveraged lease assets and Canadian tax law changes.