Pitney Bowes 2014 Annual Report Download - page 83
Download and view the complete annual report
Please find page 83 of the 2014 Pitney Bowes annual report below. You can navigate through the pages in the report by either clicking on the pages listed below, or by using the keyword search tool below to find specific information within the annual report.-
 1
1 -
2
-
3
-
4
-
5
-
6
-
7
-
8
-
9
-
10
-
11
-
12
-
13
-
14
-
15
-
16
-
17
-
18
-
19
-
20
-
21
-
22
-
23
-
24
-
25
-
26
-
27
-
28
-
29
-
30
-
31
-
32
-
33
-
34
-
35
-
36
-
37
-
38
-
39
-
40
-
41
-
42
-
43
-
44
-
45
-
46
-
47
-
48
-
49
-
50
-
51
-
52
-
53
-
54
-
55
-
56
-
57
-
58
-
59
-
60
-
61
-
62
-
63
-
64
-
65
-
66
-
67
-
68
-
69
-
70
-
71
-
72
-
 73
73 -
 74
74 -
 75
75 -
 76
76 -
 77
77 -
 78
78 -
 79
79 -
 80
80 -
 81
81 -
 82
82 -
 83
83 -
 84
84 -
 85
85 -
 86
86 -
 87
87 -
 88
88 -
 89
89 -
 90
90 -
 91
91 -
 92
92 -
 93
93 -
94
-
95
-
96
-
97
-
98
-
99
-
100
-
101
-
102
-
103
-
104
-
105
-
106
-
107
-
108
 |
 |

PITNEY BOWES INC.
NOTES TO CONSOLIDATED FINANCIAL STATEMENTS
(Tabular dollars in thousands, except per share amounts)
73
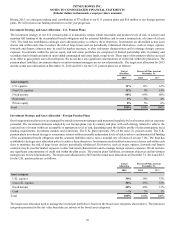
• Debt Securities – Corporate: Investments are comprised of both investment grade debt and high-yield debt The
fair value of corporate debt securities is valued using recently executed transactions, market price quotations where observable, or
bond spreads. The spread data used are for the same maturity as the security. These securities are classified as Level 2.
• Mortgage-Backed Securities (MBS): Investments are comprised of agency-backed MBS, non-agency MBS, collateralized mortgage
obligations, commercial MBS, and commingled funds. These securities are valued based on external pricing indices. When external
index pricing is not observable, MBS are valued based on external price/spread data. If neither pricing method is available, broker
quotes are utilized. When inputs are observable and supported by an active market, MBS are classified as Level 2 and when inputs
are unobservable, MBS are classified as Level 3.
• Asset-Backed Securities (ABS): Investments are primarily comprised of credit card receivables, auto loan receivables, student loan
receivables, and Small Business Administration loans. These securities are valued based on external pricing indices or external price/
spread data and are classified as Level 2.
• Private Equity: Investments are comprised of units in fund-of-fund investment vehicles. Fund-of-funds consist of various private
equity investments and are used in an effort to gain greater diversification. The investments are valued in accordance with the most
appropriate valuation techniques, and are classified as Level 3 due to the unobservable inputs used to determine a fair value.
• Real Estate: Investments include units in open-ended commingled real estate funds. Properties that comprise these funds are valued
in accordance with the most appropriate valuation techniques, and are classified as Level 3 due to the unobservable inputs used to
determine a fair value.
• Securities Lending Fund: Investment represents a commingled fund through our custodian's securities lending program. The U.S.
pension plan lends securities that are held within the plan to other banks and/or brokers, and receives collateral, typically cash. This
collateral is invested in a short-term fixed income securities commingled fund. The commingled fund is not listed or traded on an
exchange and is classified as Level 2. This amount invested in the fund is offset by a corresponding liability reflected in the U.S.
pension plan's net assets available for benefits.
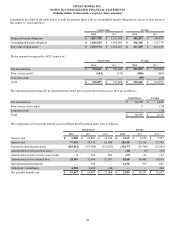
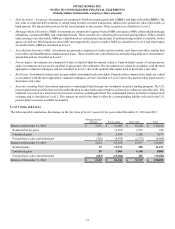
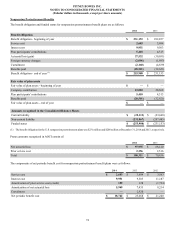
Level 3 Gains and Losses
The following table summarizes the changes in the fair value of Level 3 assets for the years ended December 31, 2014 and 2013:
Mortgage-backed
securities Private equity Real estate Total
Balance at December 31, 2012 $ 3,191 $ 91,805 $ 63,168 $ 158,164
Realized (losses) gains — (1,591) 1,939 348
Unrealized gains 205 2,190 5,182 7,577
Net purchases, sales and settlements (762)(4,934)(2,372) (8,068)
Balance at December 31, 2013 2,634 87,470 67,917 158,021
Realized gains 12 11,174 285 11,471
Unrealized gains 59 1,886 6,140 8,085
Net purchases, sales and settlements (603)(19,284) 405 (19,482)
Balance at December 31, 2014 $ 2,102 $ 81,246 $ 74,747 $ 158,095